Introduction
Welcome to the first lesson of your course on building scalable and resilient systems. Our journey begins by tackling a fundamental challenge in backend development, especially within the Node.js ecosystem: performance. Your goal to optimize the Problem-Finder Reddit app, which currently feels slow because it fetches data and generates embeddings on-the-fly, provides a perfect starting point.
In this lesson, we will focus on the root cause of such performance issues. The learning outcome is to be able to identify performance bottlenecks caused by synchronous, on-the-fly data processing in a Node.js application. We'll explore the core architecture of Node.js, understand why certain operations can grind your application to a halt, and learn practical techniques to pinpoint these troublesome spots in your code. This foundation is crucial for everything that follows, from implementing efficient search algorithms to designing robust, data-intensive systems.
The Heart of Node.js: A Single-Threaded Concurrency Model
At its core, Node.js operates on an event-driven, non-blocking I/O model. This architecture is what allows it to handle a large number of concurrent connections with high performance, using a small number of threads. The central component orchestrating this is the event loop.
To understand why "on-the-fly" processing can be problematic, we first need to grasp how Node.js manages tasks.
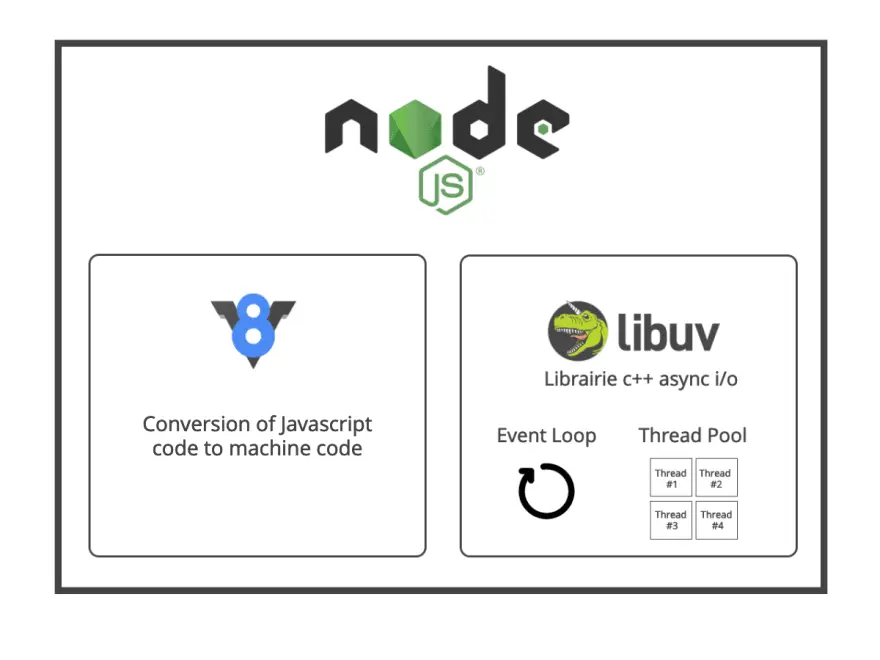
Your JavaScript code runs on a single main thread, managed by the event loop. When an asynchronous operation is initiated (like a database query or a network request), Node.js doesn't wait for it to finish. Instead, it offloads the operation to the system (often handled by libuv and its worker threads), registers a callback function, and continues executing other code. When the operation completes, the corresponding callback is placed in an event queue. The event loop continuously checks this queue and executes any pending callbacks.
This flow is what makes Node.js so efficient for I/O-bound applications.
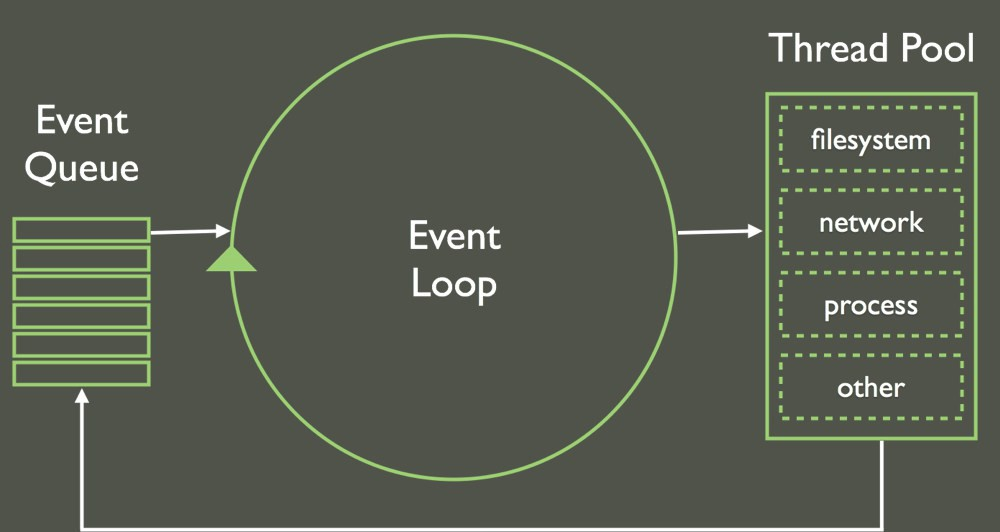
Let's solidify this understanding by reading a brief, official overview of the Node.js architecture.
Don't Block the Event Loop (or the Worker Pool) | Node.js Learn
This document from the official Node.js website provides a clear explanation of the event-driven architecture. It's essential for understanding the division of labor between the Event Loop and the Worker Pool.
Please read the sections titled A quick review of Node and What code runs on the Worker Pool?. As you read, focus on the distinction between what runs on the main event loop (your JS callbacks, non-blocking I/O) and what gets offloaded to the worker pool (expensive I/O and CPU-intensive tasks).
The key takeaway is that the event loop must remain free to process incoming events and execute their callbacks. If it gets stuck on a long-running task, your entire application becomes unresponsive.
The Bottleneck: Blocking the Event Loop
When a synchronous, long-running task executes on the main thread, it prevents the event loop from moving on to anything else. This is called "blocking the event loop." While the loop is blocked, your application cannot handle new incoming requests, process I/O events, or execute any other timers or callbacks. For a server, this means all other connected clients have to wait, leading to high latency and a poor user experience.
This is precisely the issue with your Problem-Finder app. When a search request comes in, the synchronous process of fetching data from Reddit and then generating embeddings on-the-fly likely ties up the event loop, making the application feel sluggish.
What kind of operations can cause such blocking?
Don't Block the Event Loop (or the Worker Pool) | Node.js Learn
This section of the same article provides concrete examples of common blocking operations. Recognizing these patterns in your own code is the first step to identifying bottlenecks.
Please read the section Don't block the Event Loop. Pay close attention to the four main culprits identified: Callbacks with high computational complexity. Vulnerable regular expressions (ReDoS). Synchronous APIs in core modules (like fs.readFileSync). Large JSON operations (JSON.parse and JSON.stringify).
The article mentions that some core module APIs have synchronous versions intended for scripting, not for server-side use. Let's look at a practical demonstration of this.
Node.js Monitoring - Measure Event Loop Lag
This blog post provides a clear, practical example of how a single line of synchronous code can drastically impact performance.
Read the section titled Monitoring Node.js event loop lag. Focus on the code example that uses readFileSync. Notice how adding this single synchronous function causes "massive latency spikes." This concept of "event loop lag"—the delay between when a task is scheduled and when it actually executes—is a direct measure of how blocked your event loop is.
CPU-intensive tasks, not just I/O, are a major source of blocking. The following video demonstrates this with a simple prime number calculation.
Node.js Performance: optimizing the Event Loop
This video from the "Software Developer Diaries" channel provides a visual demonstration of a CPU-intensive synchronous task blocking the event loop.
Watch from the start of the demo. The presenter runs a script that has a setInterval function supposed to fire every millisecond. However, because a synchronous, CPU-heavy findPrime function is running, the setInterval callback never gets a chance to execute. This is a classic symptom of a blocked event loop.
Practical Techniques for Identifying Bottlenecks
Now that you understand what blocking is and what causes it, how do you find it in your own applications? There are two primary methods: manual code inspection and automated profiling.
1. Code Inspection
Based on what you've just learned, you can proactively audit your codebase for common anti-patterns:
- Synchronous I/O: Look for functions ending in
Sync, likefs.readFileSync()orchild_process.execSync(). - Heavy Computation: Are there complex loops, recursive functions, or data transformations that might take significant time depending on the input? The embedding generation in your
Problem-Finderapp falls into this category. - JSON operations on large objects: Be wary of
JSON.parse()andJSON.stringify()on potentially large inputs, especially from external APIs or user requests. - Complex Regular Expressions: Review any complex regex patterns, especially those used for input validation, as they can be a source of ReDoS attacks.
Think about the workflow of your Problem-Finder app when a search query is received. You are fetching data from the Reddit API and then generating embeddings. Both of these are done "on-the-fly" within the request-response cycle. While the API call itself is likely asynchronous (if you're using a modern library like axios or node-fetch), the subsequent embedding generation is a purely CPU-bound task that, if performed synchronously, will block the event loop.
2. CPU Profiling
While code inspection is useful, it's often hard to guess where the biggest problems are. Profiling gives you concrete data. A CPU profiler samples your application's call stack at regular intervals to determine which functions are consuming the most execution time.
Modern IDEs like VS Code have excellent built-in profiling tools. The following video provides a great walkthrough of how to find and fix a real-world performance bottleneck using a profiler.
How to Debug Performance Bottlenecks in Node
This video from Web Dev Cody demonstrates a practical, iterative approach to debugging performance issues in a Node.js application using VS Code's built-in profiler.
Watch the following segments to understand the workflow: Setting up and running the profiler: See how to launch the JavaScript debug terminal and start a CPU profile. Interpreting the flame graph: The presenter analyzes the profiler's output (a "flame graph") to identify a function, get entity by ID, that is consuming a significant amount of CPU time. Refactoring the bottleneck: The inefficient function, which looped through an entire array, is refactored to use a Map for O(1) lookups, providing a significant performance improvement. This iterative cycle of profile -> identify -> refactor is a fundamental skill for any backend engineer.
You can apply this exact technique to your Problem-Finder app. By running a CPU profile while making a search request, you can get a data-driven view of where the application is spending its time. You will likely see significant time spent in the function responsible for generating embeddings.
Conclusion
In this lesson, we've laid the critical groundwork for building high-performance Node.js applications. You now understand the central role of the event loop and the severe performance degradation that occurs when it's blocked by long-running synchronous tasks.
Here are the key takeaways:
- Node.js uses a single-threaded event loop to manage concurrency, making it crucial to avoid blocking this thread.
- Synchronous operations, whether CPU-intensive (complex calculations, embedding generation) or I/O-intensive (
fs.readFileSync), will block the event loop and freeze your entire application. - Performance bottlenecks can be identified through both manual code inspection (looking for anti-patterns) and CPU profiling, which provides hard data on which functions are the slowest.
- The workflow of your
Problem-Finderapp, which performs on-the-fly data fetching and processing, is a prime candidate for these types of bottlenecks.
Now that you can identify the problem, we can start building the solution. In the next lesson, we will begin constructing the core search logic for your application. We'll start by implementing two fundamental in-memory ranking methods: keyword-based ranking and vector-based cosine similarity. This will form the basis of the hybrid search feature we'll optimize and scale throughout this course.