Introduction
Welcome to the next step in your data research journey. In our last lesson, you learned how to find and critically evaluate online sources to ensure the information you gather is reliable. But finding good data is only half the battle. To be useful, that data needs a home—a place where it can be organized, sorted, and eventually analyzed. A poorly planned spreadsheet can quickly become a digital junk drawer, making your work difficult and prone to errors.
This lesson focuses on a crucial, often overlooked skill: planning the structure of your spreadsheet before you start collecting data. You'll learn the principles of creating clean, organized, and machine-readable datasets. Think of this as drafting the blueprint for a house before you start laying bricks. A good plan now will save you countless hours of cleanup and frustration later, directly impacting the quality of the work you deliver to clients.
The Goal: Structure for Insight
Before we dive into the "how," let's focus on the "why." A well-structured spreadsheet isn't just about being neat; it's about enabling analysis. A client who asks for a list of leads isn't just buying a list of names—they're buying the potential to understand their business better. They want to answer questions like, "Which of my marketing channels is bringing in the most valuable leads?" or "Which leads should my sales team follow up with today?"
Your spreadsheet structure is what makes answering these questions possible. The video below provides an excellent real-world example of why tracking data in a structured way is so valuable for a business.
Lead Tracking Template | Free Lead Tracking Spreadsheet
In this video, "Lead Tracking Template," Mike Mancini explains the business case for structured data collection.
Watch two key parts of this video: First, watch the introduction from the beginning to 01:19 to understand why simply "knowing the phone is ringing" isn't enough. Then, jump ahead and watch the section from 03:06 to 05:30. Pay close attention to how he uses the organized data in his spreadsheet to automatically calculate which lead sources are generating actual revenue. This is the payoff of good planning.
As you can see, the ability to generate those summary tables at the bottom is a direct result of how the data was organized in the columns above. This is our goal: to structure data in a way that makes it easy for you (or a computer) to analyze it later.
The Principles of "Tidy Data"
To achieve this goal, we can follow a set of principles often referred to as creating "tidy data." This is a concept championed by data scientists for making datasets easy to work with. For a freelance researcher, it's the professional standard for organizing information.
The University of Iowa Libraries provides a fantastic guide on this. Let's review the core rules.
Spreadsheet Data Structure - University of Iowa Libraries
This guide outlines the best practices for creating well-organized spreadsheets. It's the foundation of everything we'll do when collecting data.
Please read through the "Best Practices" section of the document. Focus on these key rules: Make your Spreadsheet a Rectangle: Read the section on this principle. The main takeaway is that each sheet should contain only one table of data. Put One Piece of Information in a Cell: Study the explanation for why you shouldn't combine data. For example, a person's first and last name should be in separate columns. Be Consistent with Variables: Read the section on why consistency is crucial. Using "USA" in one row and "United States" in another will be treated as two different countries by the software. Don’t Use Colors as Data: Understand why you shouldn't use visual cues alone to store information by reading this section. Instead of coloring a row red to mean "Urgent," you should have a column named "Priority" with the value "Urgent."
Let's summarize these rules in the context of a practical freelance task, like building a lead list:
- Each row is one observation. For a lead list, each row represents one unique lead (a person or company).
- Each column is one variable. Each column holds a specific piece of information about that lead, such as
FirstName,LastName,Company,Email, orLeadSource.
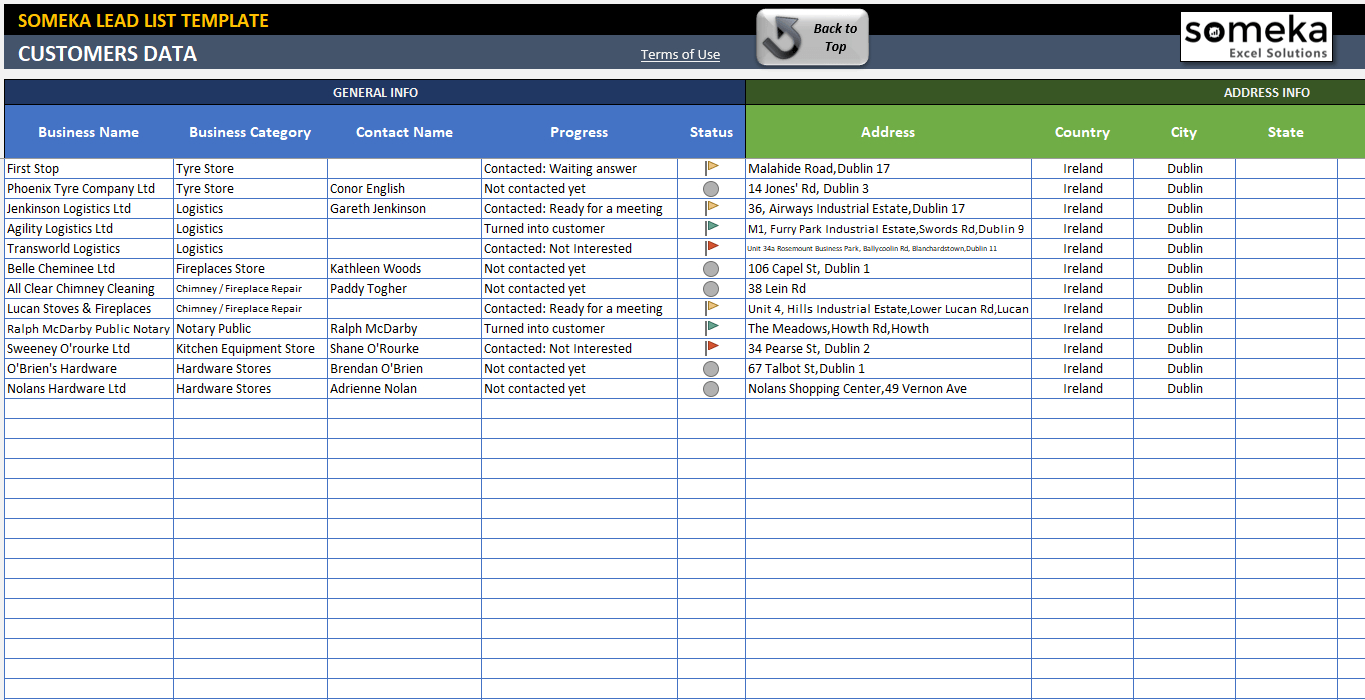
Here are a couple of examples of what a well-structured lead tracker looks like. Notice how they follow the "tidy data" principles.
A Practical Planning Process
Now, let's turn these principles into a step-by-step process you can use for any data collection task. We'll stick with the lead generation example.
Step 1: Define Your Goal and Ask Questions
Before you create a single column, ask yourself: What questions does this spreadsheet need to answer? This is the most important step.
For a lead list, the questions might be:
- Who are my potential customers? (Name, Title, Company)
- How can I contact them? (Email, Phone, LinkedIn Profile URL)
- Where did I find this lead? (Lead Source)
- What is the current status of this lead? (Status)
- When did I last interact with them? (Last Contact Date)
- How valuable could this lead be? (Potential Value)
Step 2: Translate Questions into Column Headers
Your questions directly inform your columns. Each question corresponds to one or more columns (variables).
- Who? ->
FirstName,LastName,Title,Company - How to contact? ->
Email,PhoneNumber,LinkedInURL - Where from? ->
LeadSource - What status? ->
Status - When contacted? ->
LastContactDate - How valuable? ->
PotentialValue - It's also always a good idea to add a
Notescolumn for any extra information that doesn't fit elsewhere.
This simple exercise gives you the complete blueprint for your spreadsheet. This is exactly the thought process outlined in guides for creating effective spreadsheets. For instance, the Smartsheet article on creating a sales tracker mentions this same process.
How to Make a Spreadsheet in Excel, Word, and Google Sheets
This section of a larger tutorial provides a great example of planning data structure based on analytical goals.
Read Step 2: Plan Your Data in the Google Sheets section of the article. Focus on how the author starts by listing the analytical questions they want to answer before designing the tables.
Step 3: Enforce Consistency with Data Validation
Remember the "Be Consistent" rule? The best way to follow it is to prevent inconsistent data from being entered in the first place. You can do this using data validation, which often takes the form of dropdown lists.
For fields like LeadSource or Status, you want to choose from a predefined list.
- Status: New, Contacted, Meeting Scheduled, Closed-Won, Closed-Lost
- LeadSource: LinkedIn, Company Website, Referral, Conference
The following video gives a clear, quick demonstration of how to set up columns and create these dropdowns in Google Sheets.
Simple Lead CRM Tutorial in Google Sheets [FREE TEMPLATE]
This tutorial, "Simple Lead CRM Tutorial in Google Sheets," shows the practical steps of setting up a structured sheet.
Watch these two segments: First, see how the columns are initially set up from 00:16 to 00:53. Next, watch the detailed walkthrough of creating dropdown lists for consistency from 01:13 to 04:13. This is a core skill for building robust spreadsheets.
Conclusion
You've now learned the essential framework for planning and structuring your spreadsheets like a professional. This forethought is what separates amateur data entry from professional data research. It ensures the data you deliver is not just a list of facts, but a valuable tool for analysis and decision-making.
Here are your key takeaways:
- Plan Before You Collect: Always design your spreadsheet's structure before you begin entering data.
- Start with Questions: Define the analytical goals and questions your spreadsheet needs to answer. These questions will determine the columns you need.
- Embrace "Tidy Data": Follow the core principles: one rectangular table per sheet, with rows as observations and columns as variables. Put only one piece of information in each cell.
- Enforce Consistency: Use tools like data validation (dropdown lists) to ensure categorical data is entered uniformly, making sorting, filtering, and analysis reliable.
In our next lesson, we will put this plan into action. You'll take a pre-designed spreadsheet structure and begin the hands-on process of manually extracting information from a website and entering it into the appropriate cells.