Introduction
In our last lesson, we moved from the "what" and "where" of user friction (heatmaps) to the "why" (session recordings). You learned to analyze user behavior to uncover the stories behind the data, documenting them with the Observation → Inferred Problem → Business Impact framework. These qualitative insights are powerful for building empathy and understanding.
However, to truly convince a founder or product manager to invest in your recommendations, you need to speak their language: the language of money. This lesson is about translating user friction into financial impact. Your goal isn't just to say "this is a problem"; it's to say "this problem is costing you $X per month."
Your learning outcome for this lesson is to build a financial impact calculator in Google Sheets to project the ROI of recommended fixes. This calculator will become a core, reusable asset in your audit toolkit. It's the engine that generates the hard numbers you will later embed into the persuasive Figma reports we'll build in the next module.
1. The Core Concepts of UX ROI
Before we build the calculator, let's establish the fundamental principles. Calculating Return on Investment (ROI) for UX projects boils down to quantifying the financial gain and comparing it to the cost of the investment.
To get a clear overview of the process, start with this short video from the Nielsen Norman Group. It breaks down the process into four logical steps.
Calculating ROI for Design Projects
Watch this video, 'Calculating ROI for Design Projects', to understand the foundational four-step process: collecting UX metrics, choosing a Key Performance Indicator (KPI), converting the metric into the KPI, and reporting responsibly.
Watch the entire video (3 minutes). Pay close attention to how they connect a UX metric (number of support tickets) to a business KPI (cost savings) using a clear conversion ratio (cost per ticket). This is the exact logic we will be building into our calculator.
As the video explained, the financial gains from UX improvements typically fall into two main categories:
-
Cost Savings: Reducing the company's expenses. The most common examples for a SaaS audit are:
- Reduced support tickets: A clearer interface leads to fewer confused users contacting support.
- Increased employee efficiency: (More for internal tools) A streamlined workflow allows employees to complete tasks faster.
-
Increased Revenue: Increasing the company's income. Common examples include:
- Improved conversion rates: Fixing friction in the signup or checkout funnel leads to more paying customers.
- Reduced churn: A better user experience leads to higher customer satisfaction and retention, increasing Customer Lifetime Value (LTV).
- Increased feature adoption: Guiding users to valuable premium features can drive upgrades and expansion revenue.
Our calculator will be designed to model these specific scenarios.
2. Structuring Your Financial Impact Calculator
A powerful calculator is one that is both simple to use and easy to understand. We will create a Google Sheet with separate tabs for different types of calculations, which then feed into a summary dashboard. This modular approach allows you to use only the relevant calculations for a specific client's problem.
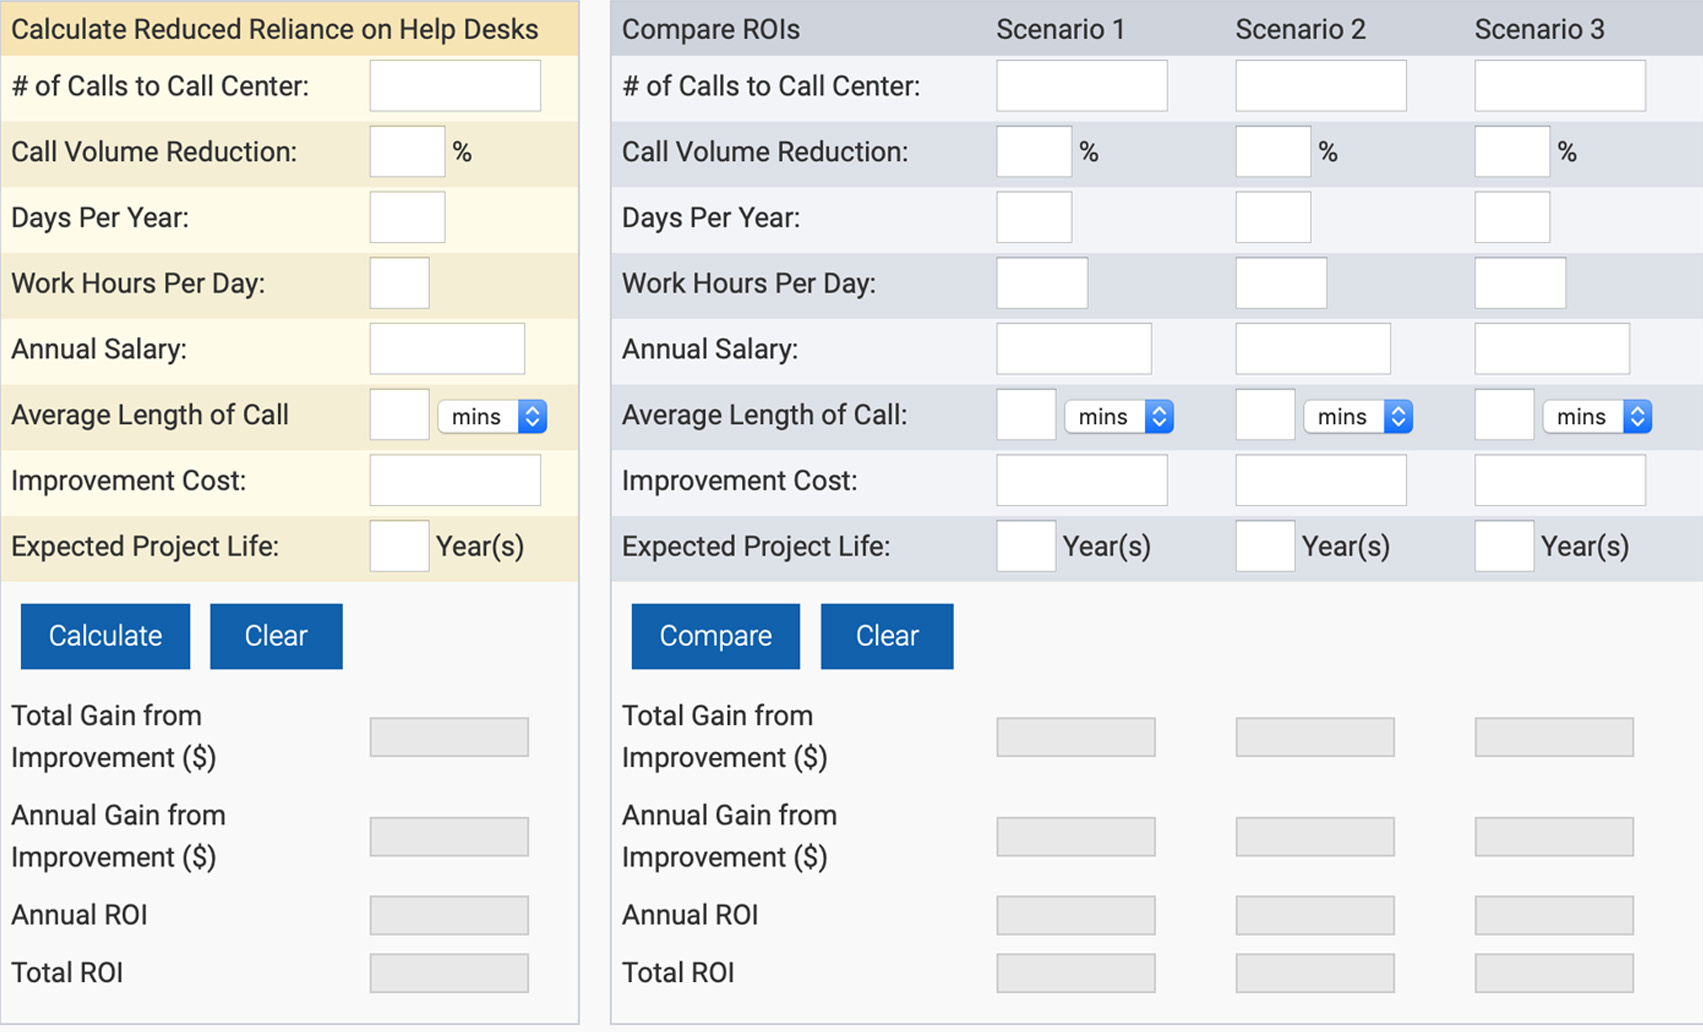
We'll structure our Google Sheet with three tabs:
Support Cost Savings: Calculates savings from reducing support queries.Conversion Revenue Lift: Calculates new revenue from improving a conversion funnel.ROI Summary: A dashboard that pulls the key financial outcomes from the other tabs for a simple, client-ready summary.
3. Building the Calculator: Step-by-Step
Let's build your reusable deliverable. Open a new Google Sheet and follow along.
Part 1: The Support Cost Savings Calculator
This is often the easiest and most direct way to show value. If you fix a confusing part of the UI, fewer users will need to ask for help.
To understand the formulas, first review this excellent resource.
Calculating the ROI of UX: A 5-Step Framework
The article 'Calculating the ROI of UX: A 5-Step Framework' from User Interviews provides a perfectly clear, step-by-step example of calculating ROI from reduced support calls. We will replicate this logic directly in our spreadsheet.
Read the section 'Simple real-world example: A step-by-step breakdown'. Focus on the variables used (calls, time per call, staff pay) and the simple formulas for calculating total cost, savings, and ROI. This is the blueprint for our first tab.
Now, let's build it. In your Support Cost Savings tab, create the following structure. The "Input" section is for variables you'll get from the client or estimate. The "Output" section is for your formulas.
| A | B | C |
|---|---|---|
| 1 | Support Cost Savings Calculator | |
| 2 | --- | --- |
| 3 | INPUTS (Client Data) | |
| 4 | Current monthly support tickets for the issue | 1000 |
| 5 | Average time to resolve one ticket (minutes) | 15 |
| 6 | Support staff average hourly wage ($) | 25 |
| 7 | Projected reduction in tickets (%) | 60% |
| 8 | Your one-time project cost (UX Audit + Fixes) ($) | 5000 |
| 9 | --- | --- |
| 10 | OUTPUTS (Calculated Impact) | |
| 11 | Cost per ticket ($) | = (B6/60) * B5 |
| 12 | Current monthly support cost ($) | = B4 * B11 |
| 13 | Tickets reduced per month | = B4 * B7 |
| 14 | Monthly Cost Savings ($) | = B13 * B11 |
| 15 | Annual Cost Savings ($) | = B14 * 12 |
| 16 | Project ROI (%) | = (B15 - B8) / B8 |
Instructions:
- Recreate this table in your
Support Cost Savingstab. - Enter the formulas exactly as shown in the
Ccolumn for rows 11, 12, 13, 14, 15, and 16. - Format cell
B16as a Percentage. - Now you can change the blue input values in column
Bto see how the financial impact changes.
Part 2: The Conversion Revenue Lift Calculator
This calculation is critical for SaaS audits where you're focused on improving signups, trial-to-paid conversions, or feature upgrades.
How to Calculate UX Design ROI: (Formula and Examples) - Tenet
The article 'How to Calculate UX Design ROI' by Tenet provides industry-specific formulas. We'll adapt their SaaS formula to create our second calculator tab.
Scroll down to 'Apply Industry-Specific ROI Models & Examples' and find the section '2. ROI of UX design for SaaS & Subscription Platforms'. Study the primary formula and the example provided. We'll focus on the 'trial-to-paid conversion' aspect.
Now, go to your Conversion Revenue Lift tab and build the following:
| A | B | C |
|---|---|---|
| 1 | Conversion Revenue Lift Calculator | |
| 2 | --- | --- |
| 3 | INPUTS (Client Data) | |
| 4 | Monthly users entering the funnel (e.g., trials) | 2000 |
| 5 | Current conversion rate (%) | 5% |
| 6 | Projected new conversion rate (%) | 7% |
| 7 | Average Customer Lifetime Value (LTV) ($) | 1500 |
| 8 | Your one-time project cost (UX Audit + Fixes) ($) | 5000 |
| 9 | --- | --- |
| 10 | OUTPUTS (Calculated Impact) | |
| 11 | Current monthly new customers | = B4 * B5 |
| 12 | Projected monthly new customers | = B4 * B6 |
| 13 | Additional new customers per month | = B12 - B11 |
| 14 | Monthly Revenue Lift ($) | = B13 * B7 |
| 15 | Annual Revenue Lift ($) | = B14 * 12 |
| 16 | Project ROI (%) | = (B15 - B8) / B8 |
Instructions:
- Recreate this table in your
Conversion Revenue Lifttab. - Enter the formulas exactly as shown in the
Ccolumn for rows 11 through 16. - Format cell
B16as a Percentage. - This calculator allows you to model the financial impact of even a small percentage point increase in conversions.
Part 3: The ROI Summary Dashboard
This final tab aggregates the key numbers from your other sheets into a clean, simple view that you can copy/paste directly into your Figma report.
In your ROI Summary tab, create the following:
| A | B |
|---|---|
| 1 | PROJECT ROI SUMMARY |
| 2 | --- |
| 3 | Projected Annual Financial Impact |
| 4 | Annual Cost Savings |
| 5 | Annual Revenue Lift |
| 6 | Total Annual Benefit |
| 7 | --- |
| 8 | Investment & Return |
| 9 | Total Project Cost |
| 10 | Net Annual Gain (Benefit - Cost) |
| 11 | Total Project ROI |
Instructions:
- Recreate this table. The formulas here pull data directly from your other two tabs.
- Make sure the sheet names in the formulas (e.g.,
'Support Cost Savings') exactly match the names of your tabs. - Format cell
B11as a Percentage. - This dashboard gives you the single most important number to present to a client: the total projected ROI.
4. Reporting Responsibly
Your calculator is a powerful tool for persuasion, but its power comes from its credibility. As the resources mention, these are estimates and projections, not financial guarantees.
When presenting your findings, always be transparent about your assumptions:
- "Based on an estimated 60% reduction in support tickets for this issue..."
- "Assuming we can lift the conversion rate from 5% to 7%..."
- "Using the average support staff wage you provided of $25/hour..."
This transparency doesn't weaken your case; it strengthens it by showing you've done your homework and are a credible, professional partner.
Conclusion
You have now built a critical, reusable asset for your consulting business. This Financial Impact Calculator is the bridge between identifying UX problems and proving their business value. You are no longer just a designer suggesting improvements; you are a consultant demonstrating how those improvements translate directly to the bottom line.
Key Takeaways:
- UX ROI is about Cost Savings and Revenue Gains. Frame your findings in these two categories.
- A Modular Calculator is Flexible. By separating calculations into different tabs, you can easily adapt your analysis to any client's specific problems.
- Separate Inputs from Outputs. This is the core principle of a good calculator template. You only change the input variables; the formulas do the rest.
- Present as Credible Estimates. Transparency about your assumptions is key to being a trusted advisor.
Preview of the Next Lesson:
You have the qualitative stories from session recordings and now the quantitative financial projections from your ROI calculator. In our next lesson, The High-Value Deliverable: Building the Audit Report in Figma, we will bring it all together. You'll learn how to structure a professional audit report and, most importantly, how to visually integrate these powerful ROI numbers to create a deliverable that doesn't just report findings—it sells the next, larger project.