Introduction
In the last lesson, you built a powerful financial asset: a calculator to estimate the support cost savings from fixing a single usability issue. This quantifies the cost of inaction for a potential client.
Today, we shift from the spreadsheet to the crime scene. Financial numbers are crucial, but showing a founder a screenshot where hundreds of their users are furiously clicking a non-clickable image is visceral, undeniable proof of a problem. This is how you make the abstract concept of "bad UX" painfully concrete.
This lesson will teach you to interpret click heatmaps to identify three of the most potent signals of user frustration:
- Rage Clicks: The digital equivalent of a user screaming at the interface.
- Dead Clicks: Clicks on elements that look interactive but do nothing, revealing broken user expectations.
- Ignored CTAs: When users click everywhere except the primary call-to-action, signaling a critical flaw in your conversion path.
Mastering this skill allows you to pinpoint exactly where money is leaking out of your client's funnel and provides the visual evidence you'll need for your audit report.
1. The Three Horsemen of User Frustration
Before analyzing a full heatmap, you need to know exactly what you're looking for. Tools like Microsoft Clarity and Hotjar are excellent at surfacing these key friction signals. Let's start with clear definitions and visual examples.
Microsoft Clarity COMPLETE Tutorial in 2026 to Skyrocket Conversions
The video 'Microsoft Clarity COMPLETE Tutorial' provides a concise, practical overview of these core friction signals. We'll use it to get a baseline understanding of what these behaviors look like and what they mean.
Watch the section from 01:18 to 05:08. The presenter defines and provides examples for rage clicks, dead clicks, and excessive scrolling. Pay close attention to the real-world scenarios he uses, like dead clicks on logos or rage clicks on pop-ups. This will build your mental library of common patterns.
To summarize and reinforce these concepts:
- Dead Clicks: Occur when a user clicks on an element that is not interactive. This is a classic false affordance—the design implies functionality that doesn't exist. It's a direct signal of user confusion.
- Rage Clicks: A rapid series of clicks in a small area. This indicates extreme frustration. The user believes something should be happening, but it's either broken, lagging, or the UI feedback is poor.
- Ignored CTAs: Not a specific click type, but a pattern where the primary call-to-action (e.g., "Start Trial," "Buy Now") has significantly fewer clicks than secondary, less important elements on the same screen. This indicates your main conversion driver is invisible, unconvincing, or being overshadowed by distractions.
Here are visual examples of how these are often represented in analytics tools:
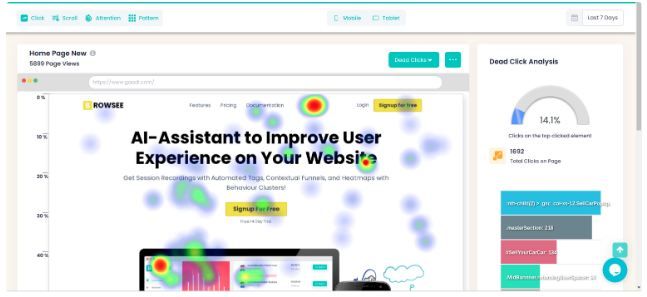

2. How to Read a Click Heatmap for Business Insights
Now that you know the signals, let's put them into practice. A heatmap isn't just a pretty picture; it's a data visualization you must interrogate with a specific goal in mind: finding revenue opportunities.
The process is simple: start with a question, identify patterns, and then segment the data to find the real story.
Website Heatmaps Guide: How To Read & Use Them
For a structured approach to heatmap analysis, we'll turn to the 'Website Heatmaps Guide' from Plerdy. It offers a tactical framework that cuts through the noise.
First, read the section 'How To Read Heatmaps Without Fooling Yourself'. Focus on the principles of starting with a question and the 'Diagnostic Table'. This table is a goldmine, directly connecting patterns like 'Hot clicks on a non-clickable image' to a likely cause and a recommended action. Next, read 'Segmentation Is The Difference Between Insight And Noise'. This is non-negotiable; analyzing an unsegmented heatmap is a common amateur mistake.
Let's see this analysis process in action.
Microsoft Clarity COMPLETE Tutorial in 2026 to Skyrocket Conversions
The Microsoft Clarity tutorial we watched earlier also has an excellent section where the presenter analyzes a heatmap for a real company. This will show you how to apply the principles from the article.
Watch from 07:13 to 18:18. Observe how he doesn't just look at red spots. He analyzes the click distribution on the main CTA, identifies dead clicks on text and images, and then moves to the 'Area Map' to get precise percentages. This is a perfect example of a professional workflow.
The key workflow is:
- Formulate a Business Question: "Is the primary CTA on the pricing page effective?" or "Why are users dropping off before filling out the demo request form?"
- Analyze the Click Map: Look for the three signals:
- Are there hot spots on non-clickable elements? (Dead Clicks)
- Are there signs of rage clicks on buttons or forms? (Rage Clicks)
- Is the primary CTA cold while secondary links are hot? (Ignored CTA)
- Segment the Heatmap: Always compare Mobile vs. Desktop. A CTA might be prominent on desktop but hidden below the fold on mobile. This is the single most common and revealing segmentation you will perform.
- Form a Hypothesis: Connect the visual evidence to a business problem. For example: "Users are ignoring the 'Sign Up' button on mobile because it's below the average scroll depth. This is likely causing a significant drop-off in mobile conversions."
3. Action: Diagnose Friction and Prep Your Evidence
Your final audit report won't just say "there are dead clicks." It will show an annotated screenshot that makes the problem undeniable. Let's practice diagnosing issues and preparing this visual evidence.
For each scenario below, write a one-sentence diagnosis that you would present to a client. Then, describe the key elements of the annotated screenshot you would create in Figma for your audit report.
Scenario 1: The Misleading Badge
- Observation: You are auditing a SaaS pricing page. The click heatmap shows a large, intense red spot over the text "Most Popular," which is styled like a badge on the middle pricing tier. This badge is not clickable; only the "Choose Plan" button below it is.
- Your Task:
- Write the diagnosis.
- Describe the annotation for your Figma report.
View Recommended Solution
- Diagnosis: "Users are attempting to select the most popular plan by clicking the badge itself, which indicates a critical design flaw (false affordance) that is creating confusion and friction right at the point of decision."
- Annotation Description:
- Base Image: Screenshot of the pricing page with the heatmap overlay.
- Arrow: A bold arrow pointing directly at the red hot spot on the "Most Popular" badge.
- Text Box: "DEAD CLICKS: 42% of clicks on this plan are misdirected to the non-interactive 'Most Popular' badge, delaying selection and causing user confusion."
Scenario 2: The Unresponsive Button
- Observation: In the checkout flow, the "Confirm Purchase" button is flagged with numerous rage clicks in your analytics tool.
- Your Task:
- Write the diagnosis.
- Describe the annotation for your Figma report.
View Recommended Solution
- Diagnosis: "Users are rage-clicking the final purchase button, which strongly suggests a technical issue, such as UI lag or a validation error, is preventing them from completing their transaction and is likely leading to cart abandonment."
- Annotation Description:
- Base Image: Screenshot of the checkout form.
- Highlight: A red circle or overlay around the "Confirm Purchase" button.
- Icon: Place a "rage click" icon (like a lightning bolt or frantic cursor) next to the button.
- Text Box: "RAGE CLICKS: High concentration of rage clicks on the final CTA indicates a critical payment failure or bug, causing extreme user frustration and direct revenue loss."
Scenario 3: The Ignored CTA
- Observation: On a landing page, the primary CTA button, "Start Your 14-Day Trial," has a cold, blue hue on the heatmap, indicating very few clicks. In contrast, a small text link below it, "See all features," is bright red.
- Your Task:
- Write the diagnosis.
- Describe the annotation for your Figma report.
View Recommended Solution
- Diagnosis: "The primary 'Start Trial' CTA is being ignored in favor of a secondary information link, signaling that users lack the confidence or key information needed to commit, and the page is failing to convert their interest into action."
- Annotation Description:
- Base Image: Screenshot of the landing page hero section with the heatmap overlay.
- Arrow 1: Pointing to the cold CTA button with the text "IGNORED CTA: Only 4% of clicks."
- Arrow 2: Pointing to the hot text link with the text "PRIMARY DISTRACTION: 38% of clicks are here, indicating a critical information gap before the user is ready to convert."
This exercise is the core of turning raw data into a compelling, client-facing argument. The combination of a sharp diagnosis and clear visual evidence is what justifies your fee.
Conclusion
You can now translate abstract user behavior into specific, identifiable patterns on a click heatmap. This is a foundational skill for any UX auditor. You're no longer just guessing; you're using visual data to pinpoint user friction with precision.
Key Takeaways:
- Heatmaps provide the undeniable visual proof of the problems your financial calculations quantify.
- Focus on identifying the three key signals: dead clicks (broken expectations), rage clicks (broken functionality), and ignored CTAs (broken conversion path).
- Always segment your data. A heatmap of "all users" hides the most important insights. Start with Mobile vs. Desktop.
- Your job is to connect the visual pattern to a business problem and present it clearly with annotated screenshots.
Preview of the Next Lesson:
A heatmap shows you what happened and where it happened by aggregating data from thousands of users. But it doesn't show you the story of a single user's journey. In our next lesson, we will dive deeper by learning to analyze session recordings. You'll see the hesitation, the erratic mouse movements, and the backtracking that tells the full story behind the red spots on your heatmap.