Welcome back. In our previous lesson, we explored the body's primary "off switch" for stress: the vagus nerve and its role in activating the parasympathetic nervous system. We established that by controlling our breath, specifically with long exhales, we can apply a "vagal brake" to slow our heart rate and initiate recovery. This naturally leads to a practical question: how can we measure the effectiveness of this system? How do we quantify our body's state of stress versus recovery on a daily basis?
This lesson addresses that question directly. We will delve into Heart Rate Variability (HRV), a powerful and non-invasive biomarker that provides a window into your autonomic nervous system's balance. Your learning outcome is to interpret heart rate variability (HRV) as a biomarker for autonomic balance and recovery status. Understanding HRV will equip you with a data-driven tool to monitor your physiological resilience and make more informed decisions about your training, work, and recovery practices.
What is Heart Rate Variability?
A common misconception is that a healthy heart beats like a metronome, with perfectly regular intervals. In reality, the opposite is true. A healthy, resilient heart is constantly adjusting its rhythm in response to internal and external demands. Heart Rate Variability is the measurement of this natural variation in the time between consecutive heartbeats.
These time intervals between heartbeats are known as R-R intervals (named for the R-peak in an electrocardiogram or ECG waveform). HRV is not a measure of your heart rate, but rather the variability in your heart rate.

As the image shows, greater variability is a sign of an adaptable, well-rested system. It indicates that your parasympathetic nervous system, via the vagal brake we discussed, is actively modulating your heart rhythm. This state of high HRV is linked to better health, fitness, and resilience to stress. Conversely, low HRV suggests your system is under stress, fatigued, and dominated by the sympathetic "fight orflight" response.
Let's ground this concept in the formal physiology. The video below provides an excellent overview of the history and science of HRV from Dr. Daniel Quintana, a leading researcher in the field.
Heart rate variability: physiology, methodology and experimental possibilities
This video provides a researcher's perspective on HRV, covering its history, physiological underpinnings, and measurement.
Watch the following segments: A historical overview of how HRV went from being considered a measurement error to a key indicator of health. An explanation of what HRV measures, specifically its role as a non-invasive proxy for parasympathetic nervous system activity and its impact on the heart's pacemaker via the sinoatrial node. A crucial clarification on the relationship between the sympathetic and parasympathetic systems. Note the debunking of the simple "opposition" model; they don't always work as a simple seesaw.
How HRV is Measured and Calculated
To interpret HRV, we must first understand how the raw data is collected and processed.
Data Collection
The fundamental measurement is the time between successive R-peaks on an ECG, the R-R interval, measured in milliseconds. While a clinical ECG is the gold standard, modern consumer technology offers reliable alternatives.
305 ‒ Heart rate variability: measure, interpret, & utilize HRV for training and health optimization
In this discussion with Dr. Peter Attia, performance coach Joel Jamieson explains the different technologies used to measure HRV and their varying levels of accuracy.
Please watch the segment from this timestamp. Pay close attention to the comparison between the ECG (gold standard), chest straps (electrical signal, very accurate), and optical sensors (PPG, measuring blood volume changes), including factors like motion artifacts and sensor location that affect accuracy.
The key takeaway is that for accurate daily tracking, a chest strap monitor that captures the heart's electrical signal is far superior to most wrist-based optical sensors, which are notoriously prone to errors from movement.
Data Cleaning
Before calculation, the raw R-R interval data must be cleaned of artifacts. These can be ectopic beats (irregular heartbeats not originating from the sinoatrial node) or errors from movement or poor sensor contact. For a statistician, the importance of cleaning data before analysis is self-evident. Even a single artifact can dramatically skew the results.
Heart rate variability: physiology, methodology and experimental possibilities
This segment demonstrates the critical importance of artifact correction in HRV analysis.
Watch this practical demonstration from this timestamp. Dr. Quintana shows how a single uncorrected artifact can nearly double the calculated HRV value, highlighting why visual inspection and data cleaning are non-negotiable steps.
The Metrics: Time and Frequency Domains
Once we have a clean series of R-R intervals, we use mathematical formulas to distill this data into a single number representing HRV. These formulas fall into two main categories: time-domain and frequency-domain.
The following reading from Marco Altini, a pioneer in applying HRV to athletic training, provides a clear and concise breakdown of the most common metrics and argues for the superiority of one particular feature for daily monitoring.
Heart rate variability (HRV) numbers: what do they mean?
This article explains the most common HRV features and provides a strong rationale for why rMSSD is the preferred metric for tracking daily recovery.
Please read the article from the beginning to this point. As you read, focus on the following: The distinction between time-domain and frequency-domain features. The definition of rMSSD and why its mathematical focus on successive differences makes it a strong proxy for vagal activity. The definitions of HF (High Frequency) and LF (Low Frequency) power. The critical explanation of why LF does not represent sympathetic activity and why the LF/HF ratio is a misleading metric for "autonomic balance".
Let's consolidate the key metrics:
-
rMSSD (Root Mean Square of Successive Differences): This is the gold-standard time-domain metric for assessing vagally-mediated HRV from short-term recordings (e.g., 1-5 minutes upon waking). The formula involves squaring the differences between adjacent R-R intervals, averaging them, and taking the square root. Because it focuses on rapid, beat-to-beat changes, it specifically captures the high-frequency influence of the parasympathetic nervous system via the vagus nerve.
-
SDNN (Standard Deviation of NN intervals): Another time-domain metric, representing the overall variability in the R-R intervals over a period. It's influenced by both sympathetic and parasympathetic activity and is more appropriate for long-term (24-hour) recordings. It is less useful for short, daily check-ins on recovery status.
-
HF (High Frequency) Power: A frequency-domain metric (0.15–0.40 Hz) that reflects the influence of respiration on heart rate (known as Respiratory Sinus Arrhythmia). Like rMSSD, it is a strong marker of parasympathetic activity and the two are highly correlated.
-
LF (Low Frequency) Power: A frequency-domain metric (0.04–0.15 Hz). It is often misinterpreted as a marker of sympathetic activity. It actually reflects a mix of influences, most notably the baroreflex (the body's blood pressure regulation system). As the resources highlight, using it to infer sympathetic tone is a common but significant error.
For your goal of using HRV to track daily focus and relaxation, rMSSD is the single most important number to track. It is reliable, easy to compute from short measurements, and directly reflects the parasympathetic activity you want to cultivate for recovery.
Interpreting HRV in Practice
HRV is not just a theoretical concept; it's a practical tool for managing stress and optimizing performance. A daily morning HRV measurement provides a snapshot of your body's recovery from the previous day's stressors—be they physical (like your powerlifting sessions) or mental.
305 ‒ Heart rate variability: measure, interpret, & utilize HRV for training and health optimization
This segment explains how to use daily HRV measurements to guide training and lifestyle decisions.
Watch the discussion from this clip. The key idea is that a standardized morning measurement reflects the net result of the previous 24 hours' stress and recovery cycle.
The trend is more important than any single day's number. A consistent or upward-trending HRV suggests you are adapting well to your training and life stressors. A downward trend is a powerful early warning sign that your cumulative stress (allostatic load) is exceeding your recovery capacity.
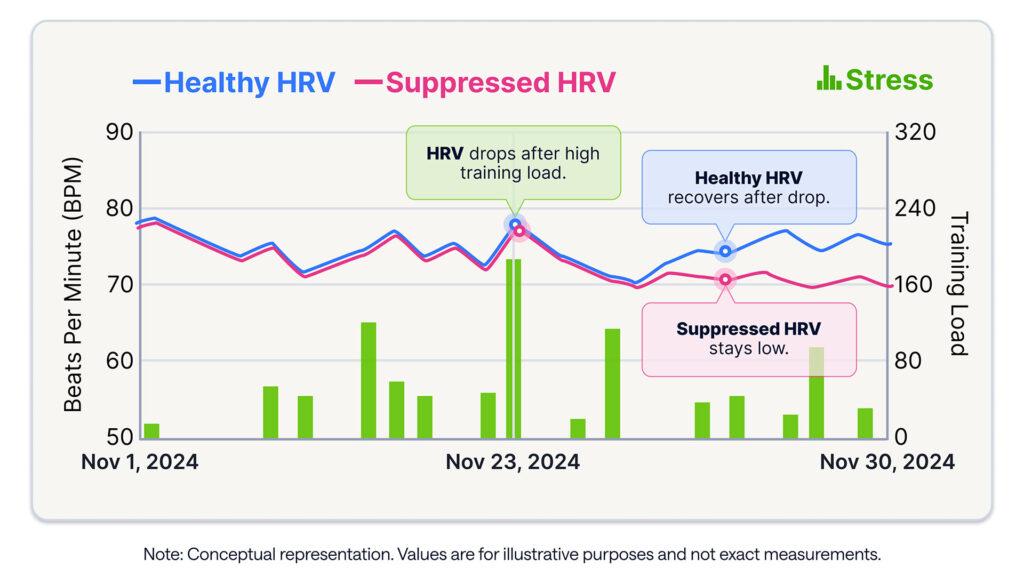
When your HRV is low, it doesn't necessarily mean you must skip a workout. It means your body is in a more sympathetic-dominant state. You might choose to reduce the intensity of your training, focus more on active recovery, or prioritize an extra relaxation session later in the day. It provides the data to make an informed, adaptive choice rather than just following a rigid plan.
Finally, it's crucial to be aware of the many factors that can influence your HRV.
Heart rate variability: physiology, methodology and experimental possibilities
Dr. Quintana lists several key confounding factors to consider when measuring and interpreting HRV.
Review the list of factors from this section. Factors like caffeine, alcohol, medications, exercise, food intake, and even hydration can significantly impact your reading.
This is why a standardized morning routine for measurement is so critical: you want to minimize these confounding variables to get a clear signal of your underlying physiological state.
Conclusion
In this lesson, we have demystified Heart Rate Variability, transforming it from an abstract concept into a tangible biomarker for your autonomic nervous system. You've learned that a healthy heart is not a metronome and that the variability between beats is a direct reflection of your body's resilience and recovery status.
We dissected the process, from data collection with different technologies to the importance of artifact cleaning. Most importantly, you learned to navigate the alphabet soup of HRV metrics (rMSSD, SDNN, LF, HF) and to confidently select rMSSD as the most robust and meaningful metric for tracking daily, vagally-mediated recovery. Interpreting trends in your HRV provides an early-warning system, allowing you to proactively manage your stress load and optimize your performance.
Here is your cheat sheet for this lesson:
HRV Interpretation Formula
-
Core Concept: Heart Rate Variability (HRV) is the measure of variation in time between consecutive heartbeats. High resting HRV = parasympathetic ("rest and digest") dominance and good recovery. Low resting HRV = sympathetic ("fight or flight") dominance and accumulated stress.
-
Key Metric for Recovery: rMSSD (Root Mean Square of Successive Differences) is the most reliable metric for short-term, morning measurements. It specifically reflects the high-frequency, beat-to-beat changes driven by the vagus nerve (parasympathetic activity).
-
Interpretation:
- Focus on the Trend: A stable or rising baseline rMSSD indicates good adaptation to stress. A multi-day downward trend signals insufficient recovery.
- Context is King: Always interpret your HRV in the context of your training, sleep, alcohol intake, and subjective stress levels. Standardize your morning measurement protocol to get a clean signal.
-
Common Pitfalls to Avoid:
- Do not use the LF/HF ratio to assess "sympatho-vagal balance"; this is based on flawed assumptions.
- Do not compare absolute HRV values with others; your baseline is genetically influenced. Compare yourself only to your own historical data.
- Ensure data is from a reliable source (chest strap preferred) and has been corrected for artifacts.
Now that we've covered the stress response, recovery pathways, and a key biomarker for measuring them, our next and final lesson in this module will synthesize all this knowledge. We will create a comprehensive cheat sheet summarizing the entire stress and recovery system, giving you a master reference for all the concepts we've discussed.