In our previous lesson, we established a powerful framework for self-experimentation, drawing on the principles of Design of Experiments to structure N-of-1 trials. You learned how to move beyond population averages to generate personalized evidence using randomization, crossover designs, and even factorial approaches to test for interactions. We now turn to the heart of any experiment: the measurement itself. An experiment is only as good as the data it produces, and this lesson is dedicated to selecting high-quality outcome measures—the "response variables" that will tell you if your interventions are truly working.
Our goal is to equip you to select appropriate measures for quantifying changes in focus and relaxation. We will explore two primary categories of data: objective metrics, which capture performance and physiology, and subjective metrics, which document your internal experience. By combining these, you can create a rich, multi-dimensional view of an intervention's impact. Given your background in statistics and social research, we will approach this topic with the rigor it deserves, examining not just what to measure, but the scientific basis and practical considerations behind each method.
1. Objective Measures: Performance and Physiology
Objective measures provide a "ground truth" that is less susceptible to cognitive biases. They fall into two main classes: direct measures of performance output and indirect physiological markers of your internal state.
Performance Metrics
These are the most straightforward indicators of focus. The key is to choose a metric that is a valid proxy for the quality and quantity of your work. Examples include:
- Productivity Output: Words written per hour, lines of code committed, number of slides created.
- Task Completion Time: Time taken to solve a standardized problem set or complete a routine report.
- Error Rate: Number of mistakes made in a proofreading task or a data entry exercise.
When using performance metrics, it's crucial to control for confounding variables. The difficulty of the task should be held as constant as possible. For instance, comparing the words written for a creative brief (a difficult task) with words written for a simple email (an easy task) would be an invalid comparison. Try to measure your performance on similar tasks across your experimental conditions.
Physiological Metrics: A Window into Your Nervous System
While performance metrics tell you what you achieved, physiological metrics can tell you how your body is handling the load. The most accessible and informative of these is Heart Rate Variability (HRV).
HRV is not the same as heart rate. Heart rate is the average number of beats per minute. HRV is the measure of the variation in time between consecutive heartbeats. A healthy, resilient nervous system is characterized by high variability, not a metronomic, steady beat. This variability provides a remarkable window into the state of your autonomic nervous system (ANS).
To understand why, let's watch a segment that explains the basics of HRV and its link to the two branches of your ANS: the sympathetic ("fight-or-flight") and parasympathetic ("rest-and-digest") systems.
How to Analyze Stress from Heart Rate and Heart Rate Variability?
This video from Firstbeat Global, a leader in HRV analytics, provides an excellent overview of the physiology behind HRV.
First, watch the introductory segment from the beginning to understand what HRV is and its general relationship with stress and health. Pay attention to the concept of HRV as a "window into the body." Next, watch the explanation of the autonomic nervous system's role. This part clearly links the sympathetic system to stress (and lower HRV) and the parasympathetic system to recovery (and higher HRV).
As the video illustrates, HRV gives us a proxy for your "autonomic balance."
- High HRV is generally associated with parasympathetic dominance, indicating a state of rest, recovery, and good adaptation.
- Low HRV is often associated with sympathetic dominance, indicating a state of stress, fatigue, or illness.
This makes HRV an excellent outcome measure for experiments on both focus (as a measure of cognitive load/stress) and relaxation (as a measure of recovery).

HRV Metrics: What to Actually Measure
Since you're a statistician, you'll appreciate that "HRV" isn't a single number but a collection of statistical metrics derived from the interbeat intervals (IBIs). The following scientific review article provides a comprehensive overview. We will focus on the most common and interpretable metrics.
An Overview of Heart Rate Variability Metrics and Norms - PMC
This paper from the journal Frontiers in Public Health is a detailed guide to HRV measurements. It's an excellent resource for understanding the different metrics and their physiological meaning.
First, read the brief introductory section, Heart Rate Variability, for a formal definition. Next, focus on the section Time-Domain Measurements. Pay particular attention to the definitions of SDNN (standard deviation of normal-to-normal intervals) and RMSSD (root mean square of successive differences). RMSSD is considered a primary indicator of vagally-mediated (parasympathetic) activity and is one of the most useful metrics for short-term measurements. Then, skim the sections on Frequency-Domain Measurements and Non-Linear Measurements to familiarize yourself with other metrics like HF (High Frequency) power, which also reflects parasympathetic activity, and Poincaré plots (SD1/SD2).
For the purpose of your self-experiments, RMSSD is likely the most practical and reliable metric to track. It's robust for short measurement periods (even a few minutes) and is the primary HRV metric reported by many consumer wearables (like Oura, Whoop, and Garmin). A higher RMSSD generally indicates a better state of recovery.
The Importance of Context
HRV is exquisitely sensitive to context. A measurement taken during a stressful meeting will be vastly different from one taken just after waking up. For valid experimental data, you must standardize your measurement protocol.
An Overview of Heart Rate Variability Metrics and Norms - PMC
This article again provides critical guidance on the factors that can influence your HRV readings and how to properly assess changes.
Please read the section titled "Context is Crucial When Interpreting HRV Measurements." This highlights the importance of standardizing factors like time of day, body position, and recent activity. Then, read the section "Assessment in Clinical and Optimal Performance Interventions." It provides a professional framework for using HRV to assess changes from an intervention, which is precisely what you are aiming to do.
A common and effective protocol is to take a 1-5 minute "readiness" measurement every morning, immediately upon waking, while still lying down. This provides a stable baseline of your autonomic state before the day's stressors begin.
2. Subjective Measures: Quantifying Your Experience
As a social researcher, you are intimately familiar with the challenge and value of measuring subjective experience. While objective data is essential, it doesn't capture the full picture of focus or relaxation. Subjective reports are indispensable for understanding your internal state.
Structured Self-Report Scales
The simplest method is to use a Likert scale to rate your state on a defined dimension. For example:
- Focus: "On a scale of 1-10, how focused were you during your last work block?" (where 1 = completely distracted, 10 = in a state of perfect flow).
- Stress: "On a scale of 1-10, what is your current stress level?" (where 1 = totally calm, 10 = extremely overwhelmed).
- Restfulness: "On a scale of 1-10, how rested do you feel upon waking?"
The key to making these scales reliable is to create clear behavioral anchors for the numbers. Before you start, take a moment to define what a '3', a '5', and a '10' feel like for you. This helps keep your ratings consistent over time.
Experience Sampling Method (ESM)
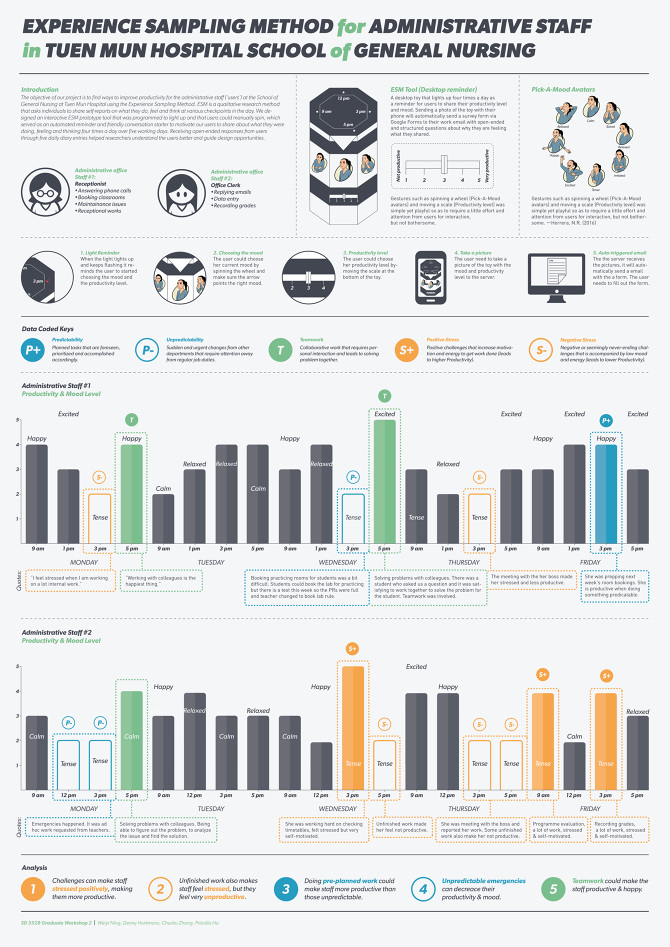
A more advanced technique, which you may have used in your research, is the Experience Sampling Method (ESM). Instead of relying on a single end-of-day rating (which is prone to recall bias), ESM involves prompting for self-reports at multiple, often randomized, times throughout the day. This provides a more dynamic and accurate picture of your internal states as they fluctuate. Many smartphone apps (like "PACO" or "Metric-Me") can be configured to run ESM protocols.
The Power of a Journal
Finally, never underestimate the value of brief qualitative notes. A simple journal entry can provide the crucial context that explains outliers in your quantitative data.
How to Analyze Stress from Heart Rate and Heart Rate Variability?
The Firstbeat video again highlights the synergy between objective data and qualitative journaling.
Watch the segment from "focus on the big picture". The speaker emphasizes how the journal is essential for understanding why a physiological stress reaction occurred (e.g., watching an exciting sports event vs. having an argument).
Your journal entry for the day might be as simple as: "HRV was lower than usual. Woke up feeling well-rested, but had a tense project deadline meeting at 11 AM. Felt wired for the rest of the day." This qualitative context is invaluable for correct interpretation.
3. Selecting Your Measures: An Iterative Approach
So, how do you choose from this menu of options? The answer depends on your experimental question. Fortunately, research on personal informatics provides a practical roadmap. Many self-experimenters face challenges in choosing the right variables, but an iterative process can lead to success.
[PDF] Lessons Learned from Two Cohorts of Personal Informatics Self ...
This paper from a leading ACM journal analyzes the self-experiments of two student cohorts. It offers invaluable lessons on the practical challenges and best practices of personal science, especially regarding variable selection.
First, look at Table 2 (view table) to see the wide variety of dependent (outcome) variables that people have tracked in their own experiments. This can serve as a source of inspiration. Next, read section 5.1, "Iterating on the self-experiment design." It highlights the common problem of choosing the wrong variables initially and proposes a solution: a multi-stage process. Finally, read the summary of this process in section 6.1, "Stages of the Self-Experiment." The three stages—Exploration, Preliminary Hypothesis Testing, and Actual Experiment—provide a fantastic template for you to follow.
Based on these findings, here is a practical workflow for selecting your outcome measures:
- Stage 1: Exploration (1 Week). Start by tracking broadly. Use a wearable to collect 24/7 HRV data. Use a journaling app to rate your focus, energy, and stress 3-4 times a day. Don't change any behaviors yet; just get a feel for the data and the tools.
- Stage 2: Preliminary Hypothesis Testing (1-2 Weeks). Formulate a specific hypothesis (e.g., "A 10-minute morning meditation session will increase my average morning focus rating and my morning HRV"). Run a short A/B experiment. The goal here is to operationalize your variables. Is the focus scale working? Is the HRV measurement protocol stable? Does the intervention seem to have any effect at all? This is your pilot study.
- Stage 3: The Real Experiment (4+ Weeks). Once you are confident in your outcome measures and protocol, begin your full, randomized N-of-1 trial as designed in the previous lesson.
For any given experiment, aim for a combination of measures:
- One primary objective measure (e.g., words written per hour).
- One primary physiological measure (e.g., morning RMSSD).
- One primary subjective measure (e.g., average daily focus score).
- Qualitative journal notes for context.
This multi-modal approach ensures that your conclusions are robust and well-rounded, capturing both external performance and internal experience.
Conclusion: Your Cheat Sheet for Outcome Measurement
You now have a systematic process for selecting and validating the metrics that will drive your personal experiments. The quality of your self-discovery hinges on the quality of your data collection.
- Measurement is Critical: The validity of your N-of-1 experiment depends entirely on the reliability and sensitivity of your chosen outcome measures.
- Combine Objective and Subjective Data: For a comprehensive view, pair objective data (performance metrics, physiological readings) with subjective data (rating scales, journal entries).
- Leverage HRV: Heart Rate Variability (HRV), particularly the RMSSD metric, is a powerful and accessible objective measure of your body's stress and recovery status. Standardize your collection protocol (e.g., every morning upon waking) for valid data.
- Use an Iterative Process: Don't commit to your outcome measures blindly. Follow a three-stage process:
- Explore: Track broadly to familiarize yourself with the data and tools.
- Pilot Test: Run a short experiment to validate and refine your chosen measures.
- Execute: Launch your full experiment with confidence in your data collection.
In our next lesson, we will begin applying this framework to a concrete goal: designing an optimal morning routine. We will take the principles of circadian biology, nutrition, and attention-setting and show how you can use the experimental designs and outcome measures you've learned to build and validate a routine that starts your day with maximal focus and energy.