Introduction
Welcome back! In the previous lesson, we broke down the theory behind the k-means algorithm, understanding its goal of minimizing the Within-Cluster Sum of Squares (WCSS) through an iterative process of assigning data points and updating cluster centers (centroids). You learned how it works conceptually.
Today, we transition from theory to practice. Your learning outcome is to implement k-means clustering using scikit-learn and select the optimal number of clusters. We will take the theoretical steps you've learned and translate them into Python code. More importantly, we'll tackle the critical question we left open: how do you choose a good value for ? This lesson will equip you with the practical tools to build, evaluate, and justify your clustering models.
Implementing K-Means with Scikit-Learn
Let's dive into the implementation. We'll use Python's scikit-learn library, the standard toolkit for machine learning. This first video will walk you through a complete example, from loading data to applying the algorithm. As you watch, you'll notice a critical practical issue arise that wasn't obvious from our theoretical discussion.
Machine Learning Tutorial Python - 13: K Means Clustering Algorithm
The video 'Machine Learning Tutorial Python - 13: K Means Clustering Algorithm' from the codebasics channel provides an excellent, hands-on demonstration. It covers loading data, applying k-means, and visualizing the initial results.
Watch the section from 07:34 to 13:52. Pay close attention to these steps: How the KMeans object is imported from sklearn.cluster. How it's initialized with a specific number of clusters (n_clusters). The use of the .fit_predict() method to both train the model and get the cluster labels for each data point. The initial, imperfect result of the clustering.
The Importance of Feature Scaling
Did you notice the problem in the video? The clusters didn't look right. The green and black clusters were mixed up, even though our eyes can clearly separate the groups.
This is similar to the incorrect clustering result from the video. Notice how the vertical axis (income) has a much larger range than the horizontal axis (age), which distorts the distance calculations.
This happens because k-means relies on Euclidean distance. If one feature (like income) has a much larger scale than another (like age), the distance calculation will be dominated by the feature with the larger scale. The algorithm effectively ignores the feature with the smaller scale.
To fix this, we must normalize or standardize our features so they are on a comparable scale. A common technique is Min-Max scaling, which rescales each feature to a range between 0 and 1.
The next part of the video demonstrates exactly how to do this and shows the dramatically improved results.
Machine Learning Tutorial Python - 13: K Means Clustering Algorithm
Now, let's see how to correct the scaling issue and achieve a much better clustering result. This part of the video introduces MinMaxScaler.
Continue watching from 13:52 to 20:54. Focus on: How MinMaxScaler from sklearn.preprocessing is used to scale the 'age' and 'income' features. How the k-means algorithm is run again on the scaled data. The improved clustering result, which now correctly separates the three groups. How to access the final cluster centers (centroids) using the .cluster_centers_ attribute.
This demonstrates a critical rule for distance-based algorithms like k-means: always scale your features before clustering.
Selecting the Optimal Number of Clusters (K)
In the example above, we could see three clusters just by looking at the scatter plot. But in most real-world scenarios, data has many dimensions and cannot be easily visualized. We need a quantitative way to choose the best value for .
Method 1: The Elbow Method
The first technique we'll explore is the Elbow Method. The intuition is this: as we increase the number of clusters (), the total WCSS (or inertia) will decrease. This is because with more clusters, each point will be closer to a centroid. At the extreme, if equals the number of data points, the inertia would be zero.
We are looking for the point where adding another cluster doesn't give us a significant decrease in inertia. This point on the plot looks like an "elbow" and is considered a good trade-off between model complexity (more clusters) and model fit (low inertia).
Machine Learning Tutorial Python - 13: K Means Clustering Algorithm
The codebasics video also provides a clear explanation and implementation of the Elbow Method.
First, watch the theoretical explanation from 04:47 to 07:34. Then, watch the Python implementation from 20:54 to 23:58. Notice how the code iterates through a range of k-values, fits a new KMeans model each time, and stores the inertia_ attribute.

The Elbow Method is a useful heuristic, but sometimes the "elbow" is not very clear, making it hard to choose definitively.
Method 2: The Silhouette Score
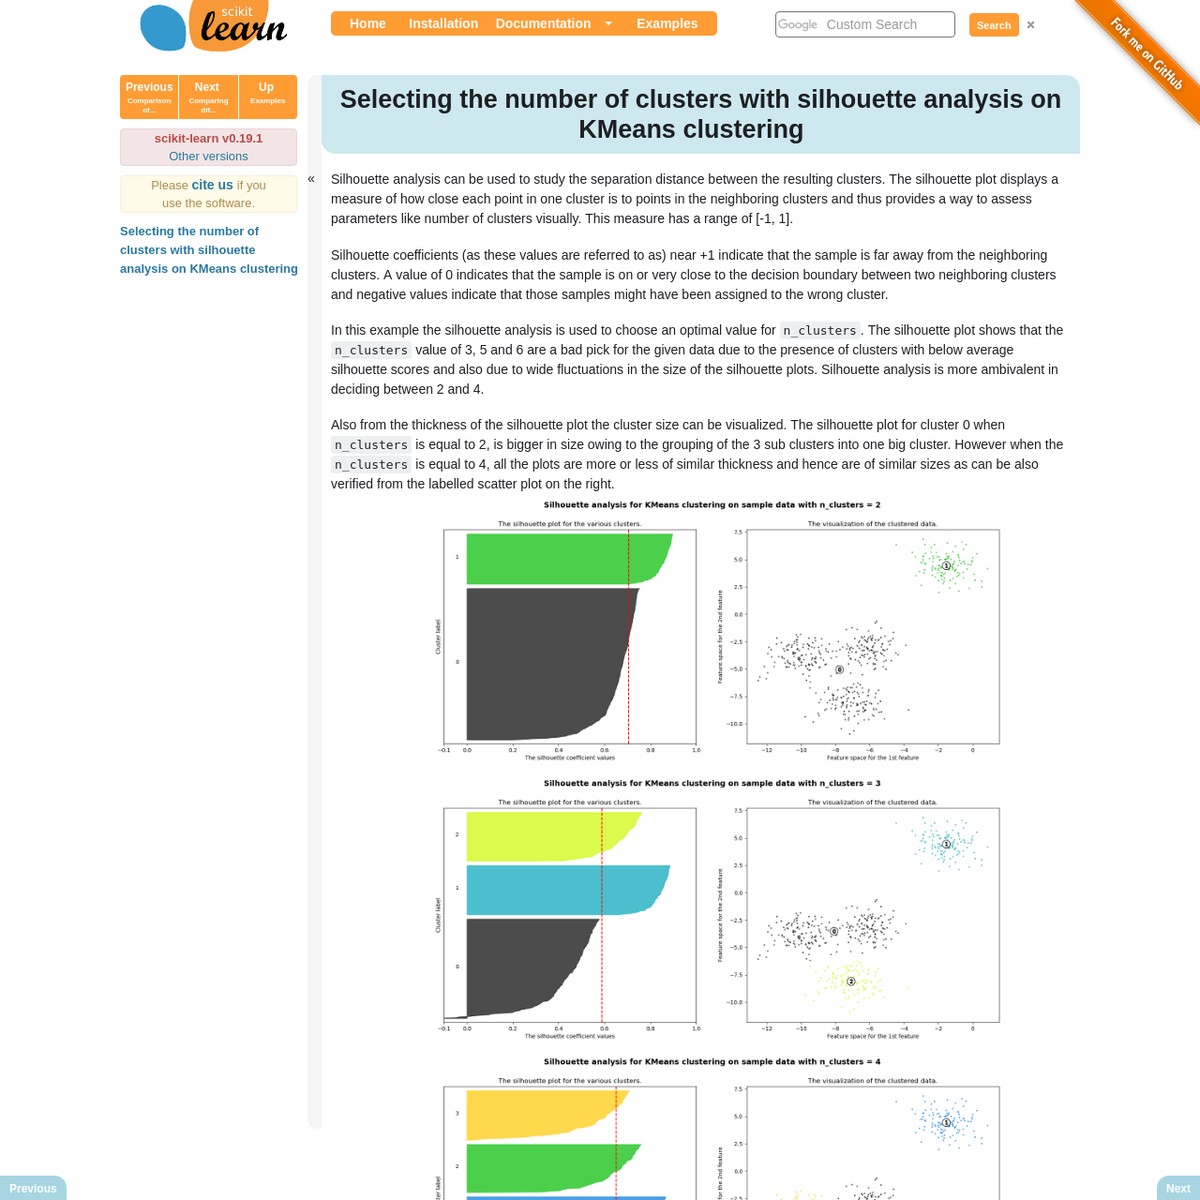
A more robust technique is the Silhouette Score. Unlike inertia, which only measures how compact a cluster is, the silhouette score measures both compactness (cohesion) and how well-separated a cluster is from other clusters (separation).
The score for a single data point is calculated as:
where:
- : The average distance from the point to all other points in its own cluster.
- : The average distance from the point to all points in the nearest neighboring cluster.
The score ranges from -1 to +1:
- +1: The point is far from other clusters and close to points in its own cluster (ideal).
- 0: The point is on or very close to the decision boundary between two clusters.
- -1: The point is likely assigned to the wrong cluster.
To find the optimal , we calculate the average silhouette score for all data points for different values of . The value of that gives the highest average silhouette score is considered the best.
Silhouette Method - Applied Machine Learning in Python
To understand the mathematics behind the Silhouette Score, please read the following section from the 'Applied Machine Learning in Python' article. This aligns with your preference for theory-first learning.
Read the entire 'Silhouette Method' section. Focus on the formulas for a(i), b(i), and s(i), and understand what each term represents. Pay attention to the interpretation of the score values (+1, 0, -1).
Now, let's see how this is implemented and interpreted in practice.
Finding The Optimal Number of Clusters in Machine Learning
The video 'Finding The Optimal Number of Clusters in Machine Learning' by NeuralNine gives a great conceptual overview and a clear coding demonstration of the Silhouette Score.
Watch the conceptual explanation from 04:20 to 05:34, where inertia and silhouette score are compared. Then, watch the implementation from 12:40 to 15:22. Notice how the highest point on the silhouette plot indicates the optimal number of clusters.
The Complete Workflow
Let's summarize the full process for applying k-means clustering and selecting the best number of clusters.
- Prepare the Data: Select the features you want to use for clustering.
- Scale the Features: Use a scaler like
StandardScalerorMinMaxScalerto bring all features to a comparable scale. This is a mandatory step. - Find the Optimal K:
- Iterate through a range of possible values (e.g., 2 to 10).
- For each , fit a
KMeansmodel on your scaled data. - Calculate and store the
inertia_for the Elbow Method plot. - Calculate and store the average
silhouette_scorefor the Silhouette Plot.
- Analyze the Plots:
- Look for the "elbow" in the inertia plot.
- Look for the peak in the silhouette score plot.
- Choose the optimal that is suggested by one or both methods.
- Build the Final Model: Instantiate and fit
KMeansone last time using your chosen optimal . - Analyze Results: You can now inspect the cluster assignments (
.labels_) and the final centroids (.cluster_centers_) to understand the characteristics of each group.
The following resource provides a complete, end-to-end Python script following this workflow.
Clustering with Scikit-Learn in Python
The 'Programming Historian' article demonstrates this full workflow. You don't need to read it in depth, but it's a good reference for seeing all the pieces put together.
Briefly review sections 5 and 6, titled 'Choosing the Right Amount of Clusters' and 'n=5 K-Means Analysis...'. This shows how the author uses elbowPlot and silhouettePlot to decide on n=5 and then builds the final model.
Conclusion
Congratulations! You have bridged the gap from k-means theory to practical implementation. You are now equipped to not only apply the algorithm but also to make a principled decision about its most important parameter, .
Key Takeaways:
- You implement k-means in Python using the
KMeansclass fromsklearn.cluster. - Feature scaling is essential for distance-based algorithms like k-means to prevent features with large scales from dominating the result.
- The Elbow Method helps find an optimal by plotting inertia against the number of clusters and looking for the "elbow" point.
- The Silhouette Score is often a more reliable method. It measures both cluster cohesion and separation, and the optimal corresponds to the highest average score.
- The
.fit_predict()method trains the model and returns cluster labels, while theinertia_andcluster_centers_attributes provide key information about the fitted model.
Preview of the Next Lesson:
In this lesson, we used the silhouette score as a tool to select the optimal number of clusters. In our next lesson, we will formalize its role as an evaluation metric to assess the quality of our final clustering solution and compare it with other potential models.