Introduction
Welcome to your seventh lesson in the "Foundations of Machine Learning" module. In our last session, we discussed the critical concepts of overfitting, underfitting, and the bias-variance tradeoff. You learned that by comparing a model's performance on training data versus test data, we can diagnose whether our model is too simple (high bias) or too complex (high variance).
This brings us to a crucial question: how do we quantify that performance? In this lesson, we will directly address this by focusing on the learning outcome: Select and apply appropriate evaluation metrics for a given problem (e.g., accuracy, MSE).
Just as a physicist needs different instruments to measure length, mass, and time, a machine learning practitioner needs a toolkit of different metrics. The choice of metric is not arbitrary; it depends entirely on the type of problem you are trying to solve and what you define as a "successful" outcome. This understanding is a core part of developing the strategic, "thinking ahead" mindset you're aiming for.
We will divide our exploration into the two main types of supervised learning problems: classification and regression.
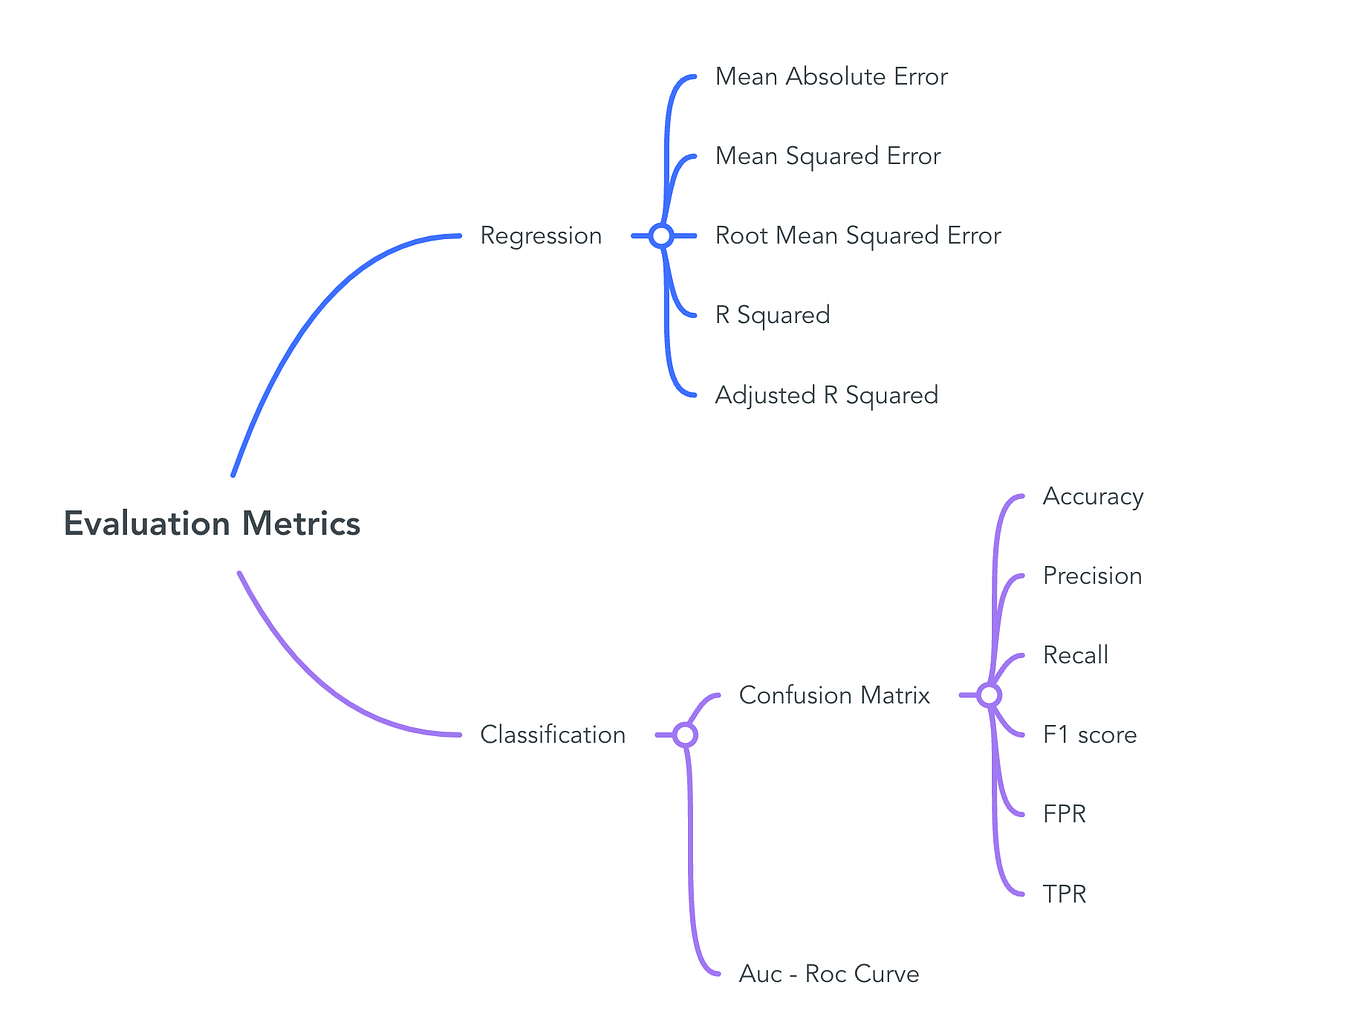
1. Evaluating Classification Models
Classification models predict a discrete category (e.g., spam or not spam, dog or cat, disease or no disease). Let's explore the metrics used to evaluate how well they do this.
How to evaluate ML models | Evaluation metrics for machine learning
To start, let's get a quick overview of the most common metrics for both classification and regression. This video from AssemblyAI provides a concise summary that will set the stage for our deeper dive.
Watch the segment from the beginning until 02:59. Focus on the definitions of accuracy, precision, and recall. We will explore the other metrics mentioned later in the lesson.
Accuracy: The Intuitive Starting Point
As the video explained, accuracy is the most straightforward metric. It answers the simple question: "What fraction of predictions did the model get right?"
While easy to understand, accuracy can be dangerously misleading, especially with imbalanced datasets.
Thought Experiment: Imagine building a model to detect a rare disease that occurs in 1% of the population. A lazy model that always predicts "no disease" would be 99% accurate, but it would be completely useless because it would never find a single person with the disease. This is why we need more sophisticated metrics.
The Confusion Matrix: A Deeper Look
To move beyond accuracy, we use a confusion matrix. It provides a detailed breakdown of a model's performance by comparing the actual labels with the predicted labels.
Let's define these terms using the disease detection example:
- True Positive (TP): The model correctly predicts a sick person has the disease.
- True Negative (TN): The model correctly predicts a healthy person does not have the disease.
- False Positive (FP): The model incorrectly predicts a healthy person has the disease. (A "false alarm" or Type I error).
- False Negative (FN): The model incorrectly predicts a sick person does not have the disease. (A "miss" or Type II error).
To solidify your understanding, the next video explains these concepts with a simple, visual example.
Precision, Recall, F1 score, True Positive|Deep Learning Tutorial 19 (Tensorflow2.0, Keras & Python)
This video from codebasics offers an exceptionally clear, step-by-step walkthrough of the confusion matrix, precision, and recall using an intuitive 'dog vs. not a dog' image classification problem.
Please watch from 00:47 to 10:59. Pay close attention to: How True Positives, False Positives, True Negatives, and False Negatives are identified (00:47 - 03:37). The definitions and calculations of Precision and Recall (04:06 - 06:01). The introduction of the F1 Score as a combination of the two (07:22 - 07:56). How these metrics appear in a classification_report from scikit-learn—this is how you'll see them in practice (07:56 - 10:59).
Precision, Recall, and F1 Score
As you saw, the confusion matrix allows us to calculate more nuanced metrics:
-
Precision: Answers "Out of all the instances the model predicted as positive, how many were actually positive?"
You prioritize precision when the cost of a False Positive is high. For example, in a spam filter, you don't want to mistakenly classify an important email as spam. -
Recall (or Sensitivity): Answers "Out of all the actual positive instances, how many did the model correctly identify?"
You prioritize recall when the cost of a False Negative is high. In our disease detection example, failing to identify a sick patient is a very costly error. -
F1 Score: This is the harmonic mean of precision and recall. It provides a single score that balances both metrics. It's particularly useful when you need a balance between precision and recall, or when you have an imbalanced dataset.
For a textual summary of these concepts, you can refer to the following resource.
Performance Metrics in Machine Learning [Complete Guide]
The article 'Performance Metrics in Machine Learning' from Neptune.ai provides concise definitions and formulas for the classification metrics we've just discussed.
Read the 'Classification metrics' section. Start from 'Accuracy' and read through to the end of the 'F1-score' subsection. This will reinforce the definitions and the trade-off between precision and recall.
2. Evaluating Regression Models
Regression models predict a continuous numerical value (e.g., house price, temperature, stock value). Here, our metrics measure the error or distance between the model's prediction and the actual value.
Let's return to the overview video to introduce the core regression metrics.
How to evaluate ML models | Evaluation metrics for machine learning
Now let's look at the regression part of the same AssemblyAI video.
Watch the segment from 06:16 to 08:32. Focus on the definitions of Mean Absolute Error (MAE), Mean Squared Error (MSE), Root Mean Squared Error (RMSE), and R-squared.
Let's formalize these definitions. Let be the number of data points, be the actual value, and be the predicted value.
-
Mean Absolute Error (MAE): The average of the absolute differences between predictions and actual values. It's easy to interpret because it's in the same units as the output variable.
-
Mean Squared Error (MSE): The average of the squared differences. By squaring the error, this metric penalizes larger errors much more heavily than smaller ones. This is often used as the cost function that models are optimized on.
-
Root Mean Squared Error (RMSE): The square root of the MSE. This metric is also in the same units as the output variable, making it more interpretable than MSE, while still retaining the property of penalizing large errors.
-
R-squared (R² or Coefficient of Determination): This metric represents the proportion of the variance in the dependent variable that is predictable from the independent variable(s). A score of 1.0 indicates the model explains all the variability, while a score of 0.0 means the model performs no better than a baseline model that just predicts the mean of the target values.
To review these in more detail, let's turn back to the Neptune.ai article.
Performance Metrics in Machine Learning [Complete Guide]
The 'Regression metrics' section of the Neptune.ai article provides clear explanations for MAE, MSE, RMSE, and R-squared.
Read the 'Regression metrics' section. Focus on the definitions and key points for Mean Squared Error (MSE), Mean Absolute Error (MAE), Root Mean Squared Error (RMSE), and R² Coefficient of determination.
3. How to Select the Right Metric
The final and most important step is learning to select the right metric for your problem. The choice depends on your specific goals. Here is a decision-making framework:
Step 1: Is your problem Classification or Regression?
- If Classification (predicting a category), go to Step 2.
- If Regression (predicting a number), go to Step 3.
Step 2: For Classification Problems...
- Is your dataset balanced?
- If yes, Accuracy is a reasonable starting point.
- If no (e.g., fraud detection, disease screening), accuracy is misleading. You must use Precision, Recall, and F1 Score.
- What is the business cost of your model's errors?
- If False Positives are more costly (e.g., a spam filter blocking an important email), prioritize Precision.
- If False Negatives are more costly (e.g., a cancer screening failing to detect a tumor), prioritize Recall.
- If both are equally important, use the F1 Score to find a good balance.
Step 3: For Regression Problems...
- Are you sensitive to outliers?
- If you want to penalize large errors heavily, use MSE or RMSE.
- If you want a metric that is less sensitive to a few large errors, use MAE.
- Do you need the error metric to be in the original units for interpretation?
- If yes, use MAE or RMSE. MSE is in squared units, which is harder to explain.
- Do you want to know how much of the data's variance your model explains?
- If yes, use R-squared. It gives you a sense of the "goodness of fit" of your model.
Conclusion
In this lesson, you've assembled a foundational toolkit for evaluating machine learning models. You now understand that simply building a model is not enough; you must be able to rigorously measure its performance in a way that aligns with your ultimate goal.
Key Takeaways:
- Model evaluation is not one-size-fits-all. The choice of metric depends on whether the problem is classification or regression.
- For classification, while accuracy is intuitive, it can be misleading on imbalanced datasets. Precision, Recall, and the F1 Score, all derived from the confusion matrix, provide a more complete picture by distinguishing between different types of errors.
- For regression, metrics like MAE, MSE, and RMSE measure the magnitude of the prediction error. MSE and RMSE penalize large errors more heavily, while MAE is more robust to outliers. R-squared measures the proportion of variance explained by the model.
- Selecting the right metric requires you to think critically about the problem context and the relative costs of different types of errors.
Preview of the Next Lesson:
So far, we've evaluated models using a single train-test split. But what if we were just "lucky" or "unlucky" with how we split the data? A single evaluation might not be reliable. In the next lesson, you will learn about k-fold cross-validation, a powerful technique for getting a more robust and stable assessment of your model's true performance.