Introduction
Welcome to the first lesson of our module on Calculus for Machine Learning. In the previous module, you successfully bridged the gap between the theory of linear algebra and its practical implementation using NumPy. You now have the tools to represent and manipulate data as vectors and matrices, which is fundamental to AI.
Now, we shift our focus to calculus, the mathematics of change. This is the engine that drives machine learning. At its core, "learning" in AI often means optimizing a model—finding the set of parameters that minimizes error or maximizes performance. To do this, we need a way to understand how a small change in a parameter affects the model's performance. This is precisely what the derivative allows us to do.
In this lesson, you will learn to explain the concept of a derivative as an instantaneous rate of change and its geometric interpretation as slope. We will unpack the core ideas behind one of the most powerful tools in mathematics, setting the stage for you to understand and eventually build learning algorithms.
1. The Paradox of Instantaneous Change
Let's begin with a familiar concept: speed. If you travel 100 meters in 10 seconds, your average speed is 10 m/s. This is a rate of change over an interval. But what is your speed at the exact instant you cross the 50-meter mark?
This question reveals a subtle but profound paradox. "Change" seems to require comparing two different points in time, while an "instant" is just a single point. How can you measure change at a single, changeless point?
The brilliant 3Blue1Brown video series, "Essence of Calculus," masterfully explores this very question. Let's watch the beginning to build a strong conceptual foundation.
The paradox of the derivative | Chapter 2, Essence of calculus
This video, 'The paradox of the derivative' by 3Blue1Brown, uses the example of a moving car to introduce the central problem that the derivative solves.
Watch from the beginning (00:00) to 04:32. Focus on these key ideas: Why the phrase 'instantaneous rate of change' is an oxymoron. How a distance-vs-time graph represents a car's journey. The core conflict: we want to know the velocity at a single instant, but calculating velocity requires two separate points in time (change in distance / change in time).
As the video highlights, our intuition for "speed at a moment" clashes with the definition of speed itself. The founders of calculus grappled with this same paradox. Resolving it is the key to understanding derivatives.
2. From Average Rate to Instantaneous Rate
Before we can define the rate of change at a single point on a curve, let's revisit a simpler concept you are likely familiar with: the slope of a straight line.
Intro to Derivatives | Calculus for Machine Learning
In this video, Kylie Ying starts her 'Calculus for Machine Learning' series by reviewing the concept of slope, which is the foundation for understanding the derivative.
Watch the segment from 00:37 to 08:44. This will be a good review of how to calculate the slope of a straight line using 'rise over run', or more formally, \text{slope} = \frac{\Delta y}{\Delta x} = \frac{y_2 - y_1}{x_2 - x_1} Pay attention to the interpretation of positive, negative, and zero slopes.
The slope of a line represents its constant rate of change. For a curve, however, the rate of change is not constant—the graph's steepness changes from point to point.
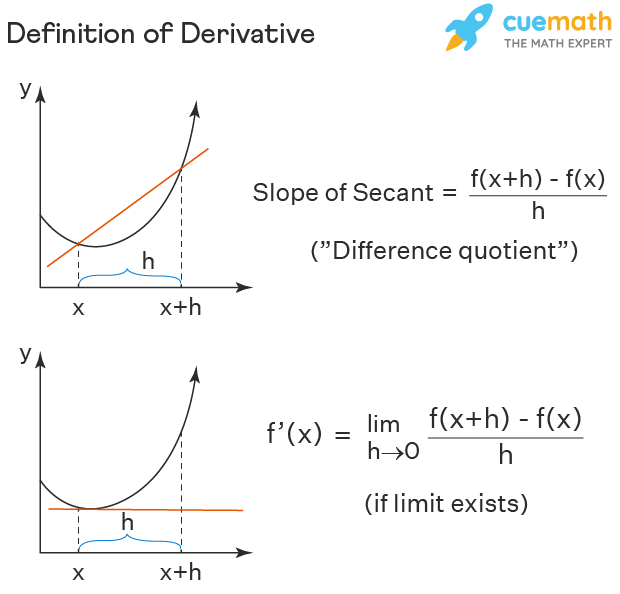
So, how can we talk about the "slope" of a curve? We can start by approximating it. Imagine picking two points on the curve that are very close to each other and drawing a straight line through them. This is called a secant line. The slope of this secant line gives us the average rate of change between those two points.
This is exactly how a car's speedometer works in the real world: it measures the distance traveled over a very tiny time interval and calculates the speed.
Let's return to the 3Blue1Brown video to see this idea in action.
The paradox of the derivative | Chapter 2, Essence of calculus
This segment explains how we can approximate an 'instantaneous' rate by measuring the change over a very small but non-zero interval, dt.
Watch from 04:32 to 07:13. Notice how the ratio ds/dt (a small change in distance over a small change in time) corresponds to the 'rise over run' slope of a secant line connecting two very close points on the graph.
This gives us a practical way to approximate the rate of change. But in mathematics, and for the theoretical precision needed in AI, an approximation isn't enough. We need the exact value.
3. The Limit: The Heart of the Derivative
The ingenious solution in calculus is to ask: what happens to the slope of our secant line as we make the interval smaller and smaller? What value does this slope approach as the change in time, dt (or Δx), gets infinitesimally close to zero?
This "approaching" value is called a limit, and it is the formal definition of the derivative.
Geometrically, something beautiful happens. As the two points defining the secant line get closer and closer together, the secant line pivots until it just "touches" the curve at a single point. This new line is called the tangent line.
The derivative of a function at a point is the slope of the tangent line at that point.
This is the central geometric interpretation of the derivative.
Let's watch the finale of the 3Blue1Brown segment to see this crucial idea visualized.
The paradox of the derivative | Chapter 2, Essence of calculus
This final segment resolves the paradox by introducing the concept of a limit and showing how it connects the slope of secant lines to the slope of the tangent line.
Watch from 07:13 to 09:44. This is the most important part of the lesson. Focus on understanding that the derivative is not the slope for a specific tiny dt, but the value that the slope approaches as dt approaches zero.
Here is a static image that summarizes this entire process.
Let's look at a concrete example. The function forms a parabola. The derivative at any point x on this parabola is given by the function . (You'll learn how to calculate this in the next lesson). This means at , the slope of the tangent line should be .

4. An Alternative Intuition: Removing the Error
Another way to think about the derivative is through the lens of measurement. Any measurement of change requires a "before" and an "after," which introduces a small interval (dx). This interval can be seen as a form of "measurement error." The derivative is the true rate of change once you mathematically remove the effect of that measurement interval.
The article from BetterExplained provides a wonderful analogy for this.
Calculus: Building Intuition for the Derivative
This article, 'Calculus: Building Intuition for the Derivative,' offers a different way to think about the process using analogies.
Read the sections 'Running the Treadmill' and 'Understanding the derivative'. Focus on the 'Santa on a treadmill' analogy. Think about the 'measurement effect' of the electrodes. The derivative is like finding the true heart rate by figuring out how to remove the effect of the electrodes from the measurement.
This perspective reinforces the core idea: we use a small, finite interval dx to get a measurable rate of change, and then use the concept of a limit to see what the rate would be if dx were to vanish entirely.
Conclusion
In this lesson, we tackled the foundational concept of the derivative from multiple angles. You've built a strong intuition for what it represents, which is far more important than just memorizing formulas.
Key Takeaways:
- The derivative measures the instantaneous rate of change of a function at a specific point.
- This concept is initially paradoxical because "change" requires an interval, while an "instant" does not.
- We resolve this by calculating the average rate of change over a tiny interval (the slope of a secant line) and finding the limit of this value as the interval shrinks to zero.
- Geometrically, the derivative at a point gives the slope of the tangent line to the function's graph at that point. A positive derivative means the function is increasing, a negative derivative means it's decreasing, and a zero derivative often indicates a peak, valley, or flat spot.
Preview of the Next Lesson:
Now that you understand what a derivative is conceptually, the next step is to learn how to calculate it. In our next lesson, we will move from intuition to computation, learning the basic rules for finding the derivatives of common functions like polynomials and exponentials. This will give you the practical tools needed to start using calculus for optimization.