Welcome back. Last time, you calculated how companies’ starting weights and share-price returns combine to move an index. The same principle applies when companies are grouped by industry: a sector’s importance depends on its share of index value, not how many companies belong to it.
This lesson uses two dated snapshots to identify the FTSE 100’s largest industry exposures. You will also see why a sector-weight chart helps interpret a headline movement without predicting the next one.
Reading the sector-weight chart
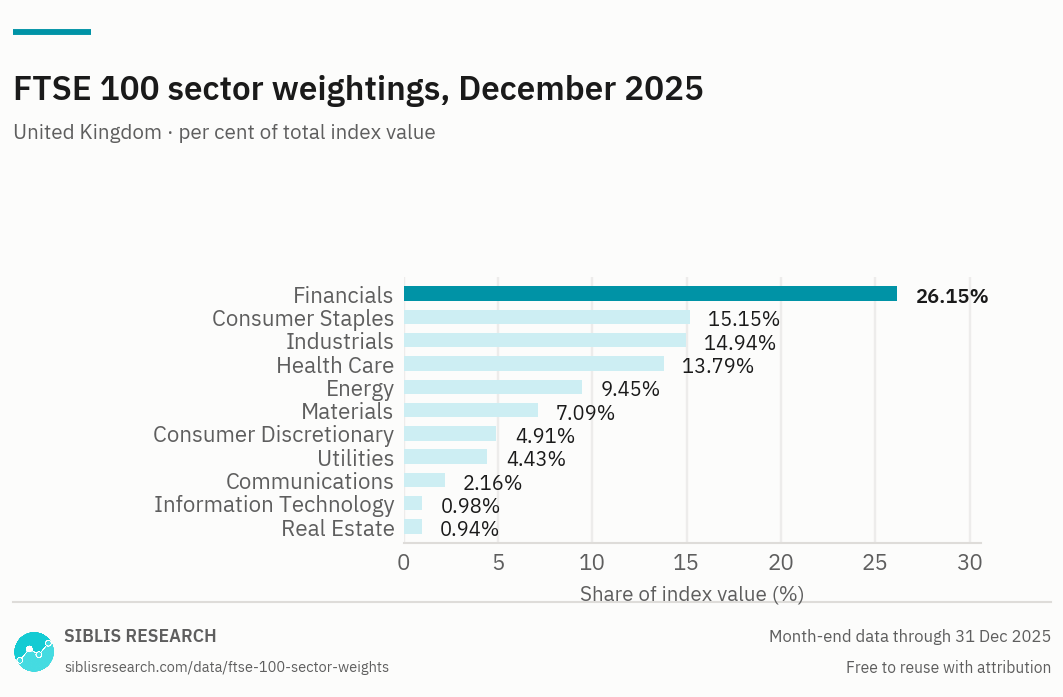
Start with the longest bar: Financials accounted for 26.15% of index value in this snapshot. That does not mean 26.15% of FTSE 100 companies were financial companies. Nor does it mean financial shares rose by 26.15%. It means that roughly £26.15 of every £100 of included index market value was assigned to that sector.
The next three largest weights were Consumer Staples (15.15%), Industrials (14.94%), and Health Care (13.79%). Together, those four sectors made up:
So approximately 70% of index value sat in four sectors. By contrast, Information Technology was 0.98% and Real Estate 0.94%. The chart describes a basket with many industry labels, but far from equal exposure to each one.
A sector weight is simply the combined weight of its constituent companies:
As established earlier in the course, company weights depend on included, free-float-adjusted market value. Counting company names cannot substitute for adding those weights.
Checking counts against weights
An earlier FTSE 100 snapshot makes the distinction particularly clear. Read the FTSE 100 columns in the “ICB Supersector Breakdown” table; the adjacent FTSE All-Share columns describe a different index. This table uses ICB supersectors, whereas the December 2025 chart uses broader sector labels. Treat them as separate dated snapshots, not as rows to combine into one dataset.
Read the London Stock Exchange's September 2024 FTSE 100 supersector table to compare constituent counts with index weights directly.
In the “ICB Supersector Breakdown” table, find the row beginning “1010 Technology” and read through the Totals row, immediately before “INFORMATION.” Focus on the FTSE 100 columns headed “No. of Cons” and “Wgt %.” In particular, compare the Health Care, Retailers, Industrial Goods and Services, and Energy rows.
In that September 2024 table, Energy had two constituents and a 10.70% weight. Retailers had six constituents but only a 1.53% weight. Six company names therefore represented much less index value than two others. Similarly, Health Care’s six constituents carried a 13.71% weight, exceeding the 11.54% weight of the 17 constituents in Industrial Goods and Services.
These comparisons do not imply that every energy or health-care company was individually large. They show what the combined included market values were for those groups at that date. The number of constituents answers “How many?”; the weight answers “How much of this index?”
The labels matter as much as the dates. For example, the September 2024 table lists Banks, Financial Services, and Insurance as separate supersectors, while the December 2025 chart shows a broad Financials category. A sound comparison first checks whether two figures describe the same classification and the same date.
From exposure to a possible index contribution
A weight indicates how strongly a sector could influence the index for a given sector return. It does not tell you what return that sector actually earned. Using the December 2025 weights solely as a simplified starting basket, suppose Financials rose 2% while every other sector stayed unchanged. Its contribution to the index movement would be:
Under the same assumption, a 2% rise in Information Technology would contribute:
The share-price movement is identical in this illustration; the index effects differ because the starting weights differ. In a real trading day, companies within a sector need not move together, other sectors also move, and weights change over time. You would use the weights appropriate to the period being analysed, not automatically reuse a December 2025 chart for a later headline.
Sector concentration is a description of exposure, not a forecast. A large Financials weight makes financial-company price moves consequential for the FTSE 100, but the chart cannot say whether those prices will rise or fall. Nor should “Financials” be read as shorthand for the entire UK economy: a sector label identifies a type of business, not where all its revenue is earned. That geographic distinction becomes important in the next lesson.
Takeaways
To identify the FTSE 100’s dominant industries, rank sectors by their dated index weights, not by company counts. In the December 2025 chart, Financials was the largest sector and the top four sectors together represented about 70% of index value. The September 2024 table demonstrates why counts can mislead and why dates and classification labels must accompany any comparison.
Next, you will examine how overseas earnings can change in sterling value when the exchange rate moves—and why that arithmetic alone does not guarantee a share-price response.