Introduction
In the previous lesson, you learned how to perform a One-at-a-Time (OAT) sensitivity analysis to create a ranked list of factors influencing a model's output. We determined, for instance, that a pig's growth rate had a greater impact on profit than the rate of market price decline. This gave us an ordered sense of importance.
However, in many complex systems, the distribution of influence is not linear. A small number of causes often generate a vast majority of the effects. Today's lesson focuses on a powerful tool for identifying this asymmetry: Pareto analysis. Your learning outcome is to apply Pareto (80/20) analysis to isolate the vital few factors from the trivial many in a system. This technique moves you from a simple ranked list to a strategic classification, allowing you to concentrate your resources on the true bottlenecks that dictate your system's performance.
The Principle of Unequal Distribution
The Pareto principle, or the 80/20 rule, is an empirical observation, not a physical law. It states that for many outcomes, roughly 80% of the consequences come from 20% of the causes. This pattern appears in phenomena governed by power-law distributions, which are fundamentally different from the Gaussian (or normal) distributions you are familiar with from many areas of physics.
To build a solid intuition for where and why this principle applies, let's explore its origins and the statistical concept of "fat tails."
Pareto, Power Laws, and Fat Tails
The video 'Pareto, Power Laws, and Fat Tails' by Shaw Talebi provides an excellent conceptual foundation. It explains the origin of the 80/20 rule and introduces the critical distinction between systems where averages are meaningful ('Mediocristan') and systems where single extreme events dominate ('Extremistan').
Watch from 02:35 to 07:35. First, focus on the origin of the Pareto principle and how a Pareto distribution's shape differs from a Gaussian one (02:35 - 04:34). Then, pay close attention to the distinction between 'Mediocristan' and 'Extremistan' (05:14 - 07:35), as this defines the domains where Pareto analysis is most relevant.
The key takeaway is that productivity, wealth, scientific citations, and many other systems relevant to your goals behave like phenomena from "Extremistan." In these domains, identifying and acting upon the "vital few" high-impact factors is the most effective strategy. Ignoring them, as the video will later illustrate, can be catastrophic.
The Pareto Analysis Workflow
Pareto analysis provides a structured, visual method for separating the "vital few" from the "trivial many." The output is a Pareto chart, a combination of a bar chart and a line graph.
The process involves several distinct steps:
- Identify and Categorize the potential causes or factors (e.g., types of errors, sources of delay, customer complaints).
- Measure the impact of each category using a consistent metric (e.g., frequency of occurrence, time consumed, cost incurred).
- Sort the categories in descending order based on their impact.
- Calculate Cumulative Percentages for the sorted categories.
- Create the Chart by plotting the impact of each category as a bar and the cumulative percentage as an overlaid line.
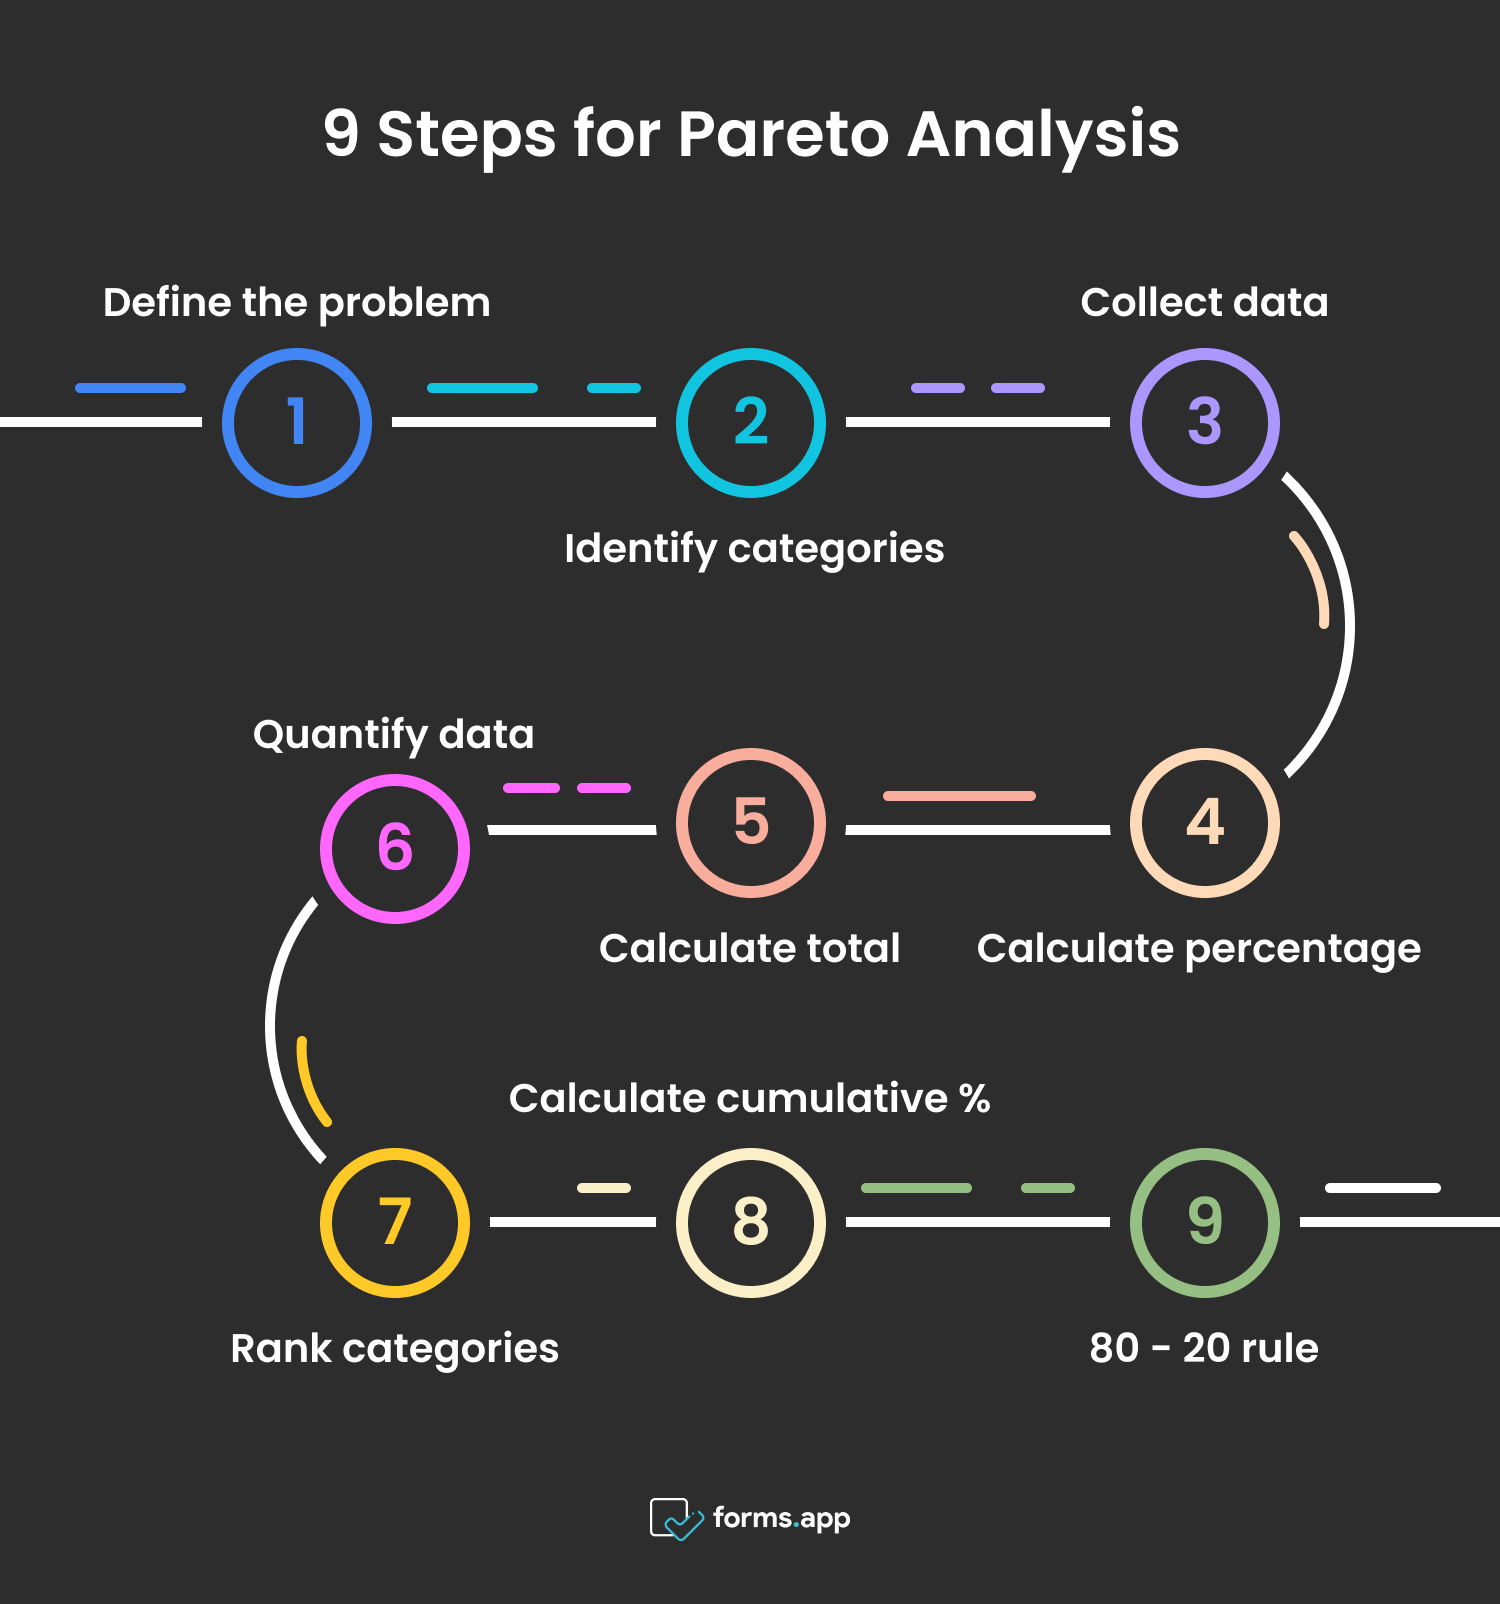
To see this workflow in action, we will follow a detailed, practical example.
Pareto Analysis (how to create a Pareto Chart, analyze results, and understand the 80 20 Rule)
The video 'Pareto Analysis' from RISR Careers offers a clear, step-by-step tutorial on constructing and interpreting a Pareto chart using a dataset of hotel complaints.
First, watch the section from 02:49 to 06:48, which demonstrates the exact procedure for creating the chart from raw data. Then, continue from 06:48 to 08:17 to learn how to interpret the completed chart to identify the 'vital few' issues.
As the video demonstrates, the analysis pinpoints the few categories of complaints that, if addressed, would eliminate the majority of customer dissatisfaction. The bend in the cumulative percentage line clearly separates the high-impact causes on the left from the long tail of low-impact causes on the right.
Application: Multi-Metric Bottleneck Identification
In the context of bottleneck analysis, the "cause" is often a system fault or stoppage, and the "effect" is lost productivity. A sophisticated analysis doesn't rely on a single metric. A fault that occurs frequently might have a negligible duration, while a rare fault could be responsible for hours of downtime. Therefore, it's crucial to apply Pareto analysis using several different metrics.
[PDF] Data-Driven Bottleneck Identification for Serial Production Lines
Let's examine a formal application of this idea from the paper 'Data-Driven Bottleneck Identification for Serial Production Lines'. This resource shows how Pareto analysis is used in an industrial setting to diagnose the root causes of capacity loss.
First, read section 3.3.1 'Pareto Analysis' (page 42) to understand the premise. Note the explicit statement that analyses are conducted using 'frequency, total duration, and mean duration on each fault type.' Then, skim Chapter 5, 'Fault Analytics Application' (pages 91-95), focusing on Figures 5.2, 5.3, and 5.4. Observe how the same fault data yields different 'top 5' lists depending on the metric used.
This multi-metric approach is essential for robust bottleneck identification.
- Frequency Pareto: Identifies chronically recurring issues. These may be candidates for process redesign or automation.
- Total Duration Pareto: Identifies the issues consuming the most time overall. These are the primary targets for improving throughput.
- Mean Duration Pareto: Identifies issues that, while perhaps infrequent, are exceptionally time-consuming to resolve when they do occur. These may point to a lack of proper tools, training, or standard operating procedures.
By creating and comparing these three charts, you gain a multi-dimensional understanding of your system's constraints, preventing you from focusing on a problem that is frequent but ultimately insignificant.
Iterative Analysis for Root Causes
A single Pareto chart identifies what the main problems are, but not necessarily why they occur. The true power of the technique, especially for strategic purposes, comes from its iterative application. Once you identify a "vital few" category, you can perform a subsequent root-cause analysis on that category alone and then apply another Pareto analysis to the identified root causes.
This links back to the concept of back-calculation from your overarching goal.
Pareto Analysis (how to create a Pareto Chart, analyze results, and understand the 80 20 Rule)
The 'Pareto Analysis' video concludes with a 'power tip' that directly addresses this advanced technique.
Watch the segment from 08:50 to 10:08, where the presenter groups several top complaints under a common theme of 'poor service.' Then, watch the 'Power Tip' from 12:01 to 13:18, which formalizes this idea of using Pareto charts multiple times to drill down to the underlying causes.
For example, if your initial Pareto analysis of a research project reveals "literature review delays" as a vital few bottleneck, a second-level analysis could break that down by cause: "difficulty accessing papers," "time spent reading irrelevant articles," "note-taking inefficiency," etc. A Pareto chart of these sub-causes would then reveal the most significant bottleneck within the literature review process, pointing to a more targeted solution.
Conclusion
You have now learned to move beyond a simple ranked list of problems to a more strategic classification of system constraints. By applying Pareto analysis, you can effectively distinguish the high-impact "vital few" from the low-impact "trivial many," ensuring your efforts are directed at the true bottlenecks.
Key Takeaways:
- The Pareto Principle (80/20 Rule): An empirical rule stating that in many systems (those in "Extremistan"), a small percentage of causes are responsible for a large percentage of effects.
- Pareto Analysis Workflow: A systematic method of categorizing, measuring, sorting, and plotting data to create a Pareto chart that visually separates the "vital few" from the "trivial many."
- Multi-Metric Analysis: For robust bottleneck identification, it's critical to perform Pareto analysis using multiple metrics, such as frequency, total duration, and cost.
- Iterative Application: Pareto analysis is not a one-off tool. It can be applied iteratively to drill down from high-level problems to their fundamental root causes.
Preview of the Next Lesson:
So far in this module, you've learned to rank influential factors with OAT analysis and isolate the most critical ones with Pareto analysis. You now know what the primary bottlenecks are. The next logical step is to quantify their precise impact on your maximum potential and evaluate the return on investment for alleviating them.
In the next lesson, we will begin Module 4 by learning how to formulate a P_max model as a linear program using personal resource variables (Time, Capital, Gatekeepers, Skill) and interpret shadow prices to quantify the marginal value of relaxing each constraint. This will bridge the qualitative identification of bottlenecks to a rigorous, quantitative framework for strategic decision-making.