Hello! Welcome to your third lesson.
In our last session, we saw how the fundamental sum and product rules of probability aren't just abstract formulas. When combined, they logically lead to Bayes' theorem, the rule for inverting conditional probabilities. We ended with this equation:
Today, we're going to bring this equation to life. Our goal is to dissect it piece by piece, giving each component a name and a clear meaning. To do this, we'll use a classic conceptual problem—medical diagnosis—that brilliantly illustrates why Bayesian thinking is so powerful, and often, so counterintuitive. By the end of this lesson, you'll be able to explain the roles of the prior, likelihood, posterior, and evidence in a Bayesian analysis.
1. The Bayesian Trap: When Intuition Fails
Let's start with a scenario. You take a medical test for a rare disease. The test is highly accurate, and your result is positive. What is the probability that you actually have the disease? Most people's intuition gets this spectacularly wrong.
The following video from Veritasium sets up this exact problem. It highlights the common logical pitfall and introduces Bayes' theorem as the tool to get us out of it.
Watch the beginning of 'The Bayesian Trap' to see how a seemingly straightforward medical diagnosis problem can be very misleading.
Watch from the beginning until 01:08. Pay close attention to the numbers: the disease prevalence (0.1%), the test's true positive rate (99%), and its false positive rate (1%). What's your gut feeling about the probability of having the disease after a positive test?
The common, intuitive answer is to say the probability is 99%, the same as the test's accuracy. As the video states, this is incorrect. The actual probability is much, much lower. This startling gap between our intuition and the mathematical reality is why a formal framework is so essential. Let's unpack why this happens.
2. Thinking with Frequencies: An Intuitive Solution
Your preference for starting with simple, intuitive explanations is perfect for this problem. The confusion arises from working with percentages and conditional probabilities directly. A much clearer way to think about it, especially at first, is to use "natural frequencies"—that is, imagining a concrete number of people and tracking them through the process.
This approach bypasses the confusing formulas and makes the logic transparent. You've worked with large datasets as a machine learning engineer, so thinking in terms of population counts should feel natural.
The video 'Bayes' Theorem Intuition' by Better Explained provides an excellent step-by-step walkthrough of the medical diagnosis problem using this 'natural frequencies' method.
Watch from 02:26 to 09:00. The presenter uses slightly different numbers for a cancer screening test, but the logic is identical. Follow how he starts with a population of 10,000 people and calculates: The number of people with and without cancer. The number of 'true positives' (people with cancer who test positive). The number of 'false positives' (people without cancer who test positive). Focus on the final step: calculating the probability by looking at the proportion of true positives among all positive tests.
As the video demonstrates, the key is to realize that while the test is accurate, the disease is very rare. Out of a large population, the small percentage of "false positives" from the huge group of healthy people ends up being a larger absolute number than the "true positives" from the tiny group of sick people.
When you test positive, you don't know which group you're in. The probability is therefore the ratio of true positives to the total number of positive tests (true positives + false positives). This is the core insight that Bayes' theorem formalizes.
3. Naming the Parts: The Language of Bayes' Theorem
Now that we have the intuition, let's map it onto the formal structure of Bayes' theorem. Let stand for our Hypothesis ("the patient has the disease") and stand for our Data ("the test was positive").
Bayes' theorem is a statement about how our belief in the hypothesis should change after observing the data.
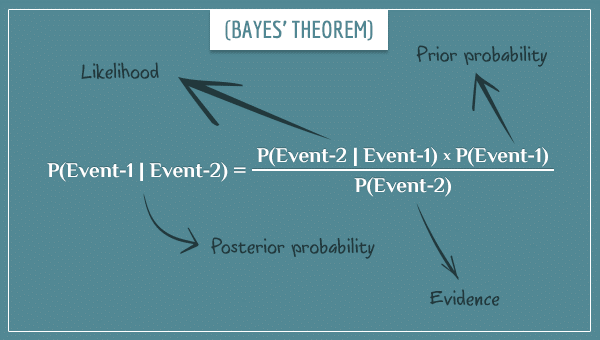
Let's define each part using the medical diagnosis example:
1. Prior Probability:
- What it is: The probability of the hypothesis before we see the data. It's our initial degree of belief.
- In our example: This is the base rate, or prevalence, of the disease. In the Veritasium example, . This is our starting point. It reflects the fact that, without any other information, we'd assume any random person has a very low chance of having this rare disease.
2. Likelihood:
- What it is: The probability of observing the data given that our hypothesis is true. This term connects the data to the hypothesis. It answers the question: "How likely would I be to see this evidence if my theory were correct?"
- In our example: This is the test's sensitivity or true positive rate. . It tells us how well our hypothesis (the patient has the disease) explains the data (a positive test). Note that this is not the probability of the hypothesis!
3. Posterior Probability:
- What it is: The probability of the hypothesis after we have taken the data into account. This is the updated belief and the quantity we usually want to find.
- In our example: This is , the probability a person actually has the disease given they tested positive. This was the 9% we found in the Veritasium example. The posterior is the logical combination of the prior and the likelihood.
4. Evidence (or Marginal Likelihood):
- What it is: The total probability of observing the data, averaged over all possible hypotheses. In our simple case, this means considering both ways to get a positive test: a true positive or a false positive.
- In our example: This is . We calculate this using the Law of Total Probability (which, as you'll recall from last lesson, is an application of the sum and product rules): This term acts as a normalizing constant. It ensures that the final posterior probability is a valid probability (i.e., between 0 and 1). It is the sum of all the ways the evidence could be produced.
To go deeper into these concepts, the following article provides one of the best intuitive walkthroughs available.
An Intuitive Explanation of Bayes' Theorem - Yudkowsky
Eliezer Yudkowsky's 'An Intuitive Explanation of Bayes' Theorem' is a classic and very thorough resource that walks through the same medical diagnosis problem in detail. It connects the intuitive frequency-based approach to the formal theorem.
I recommend reading the following parts (you can use Ctrl+F to find the headings): Start by reading from 'The correct answer is 7.8%...' to '...always requires all three pieces of information...'. This reinforces the natural frequency calculation. Then, read the section that begins 'To see that the final answer always depends...'. It uses extreme examples to build intuition about the role of the prior. Finally, read the sections that explicitly define the terms: 'The original proportion of patients with breast cancer is known as the prior probability...' and the detailed breakdown under 'Having introduced Bayes' Theorem explicitly, we can explicitly discuss its components.' Focus on how the author connects the numbers from the example back to the formal terms of the theorem.
Test your understanding!
Let's use the numbers from the Veritasium video:
Identify which of these corresponds to the prior and which corresponds to the likelihood in the calculation of .
Show answer
- Prior: The prior belief is the initial probability of having the disease before any evidence is considered. That is .
- Likelihood: The likelihood is the probability of getting the evidence (a positive test) assuming the hypothesis (has disease) is true. That is .
Conclusion
Today, we've moved from the abstract formula of Bayes' theorem to a tangible, working understanding of its parts. We saw how our intuition can fail when dealing with rare events and why a formal method is necessary.
Key Takeaways:
- Bayes' Theorem is a formal engine for updating beliefs in light of evidence.
- Prior : Your belief before seeing evidence.
- Likelihood : The power of the evidence to support your hypothesis.
- Posterior : Your updated belief after seeing evidence.
- Evidence : A normalizing factor representing the total probability of observing the evidence under all circumstances.
- Thinking in natural frequencies (e.g., "10 in 1000 people") is a powerful way to build intuition and avoid common errors.
Next time: What happens if our patient gets a second positive test? Does she now have a 9% chance? No. The core of Bayesian learning is that it's an iterative process. The posterior from one analysis becomes the prior for the next. We will explore this powerful idea of sequential updating. The last part of the Veritasium video gives a great preview of this.
To see where we are headed, watch this final clip from 'The Bayesian Trap'. It shows how the result from the first test becomes the new starting point (prior) for analyzing a second test.
Watch from 05:05 to 05:57.