Hello! Welcome to our lesson on handling skewed data.
In our previous lessons, we've built a solid foundation for data preparation. You've learned how to scale numerical features and encode categorical variables. These are essential steps to make your data suitable for machine learning algorithms. Now, we'll address another common issue with numerical data: its distribution.
Many machine learning models, especially linear models like Linear and Logistic Regression, perform best when the numerical input features follow a normal (or "bell-shaped") distribution. However, real-world data is often not so tidy. It can be skewed, meaning the data is bunched up on one side with a long tail stretching out on the other. This can cause models to be biased by the extreme values in the tail.
Today's lesson will focus on the learning outcome: Handle skewed data distributions using transformations (e.g., log transform). We'll explore what skewed data is, why it's a problem, and how to correct it using mathematical transformations, with a special focus on the common and powerful log transform.
1. What is Skewed Data?
Skewness is a measure of the asymmetry of a probability distribution. A distribution can be symmetrical, or it can be skewed to the left or right.
- Symmetrical (No Skew): The data is evenly distributed around the mean. In a perfect normal distribution, the mean, median, and mode are all equal.
- Positive Skew (Right-Skewed): The tail on the right side of the distribution is longer. This means there are a few unusually high values. In this case,
Mean > Median > Mode. This is very common in data representing quantities that can't be negative, like income, house prices, or user activity counts. - Negative Skew (Left-Skewed): The tail on the left side is longer, indicating a few unusually low values. Here,
Mean < Median < Mode.

To get a better sense of why this is important and how we can start to fix it, please watch the first couple of minutes of the following video.
📉 Fix Skewed Data in Python: 5 Transformations You Should Know!
This video from AnalytiCode provides a great introduction to what skewed data is and why we want to transform it for our machine learning models.
Watch from the beginning to 01:58. Pay attention to the explanation of how transformations work by compressing the scale of values in the long tail.
In Python, using the Pandas library, you can easily calculate the skewness of a feature with the .skew() method. A common rule of thumb is:
- If skewness is between -0.5 and 0.5, the distribution is fairly symmetrical.
- If skewness is less than -0.5, the data is negatively skewed.
- If skewness is greater than 0.5, the data is positively skewed.
2. The Log Transformation for Positive Skew
The most common type of skew you'll encounter is positive skew. Fortunately, there's a very effective and widely-used technique to handle it: the logarithmic transformation.
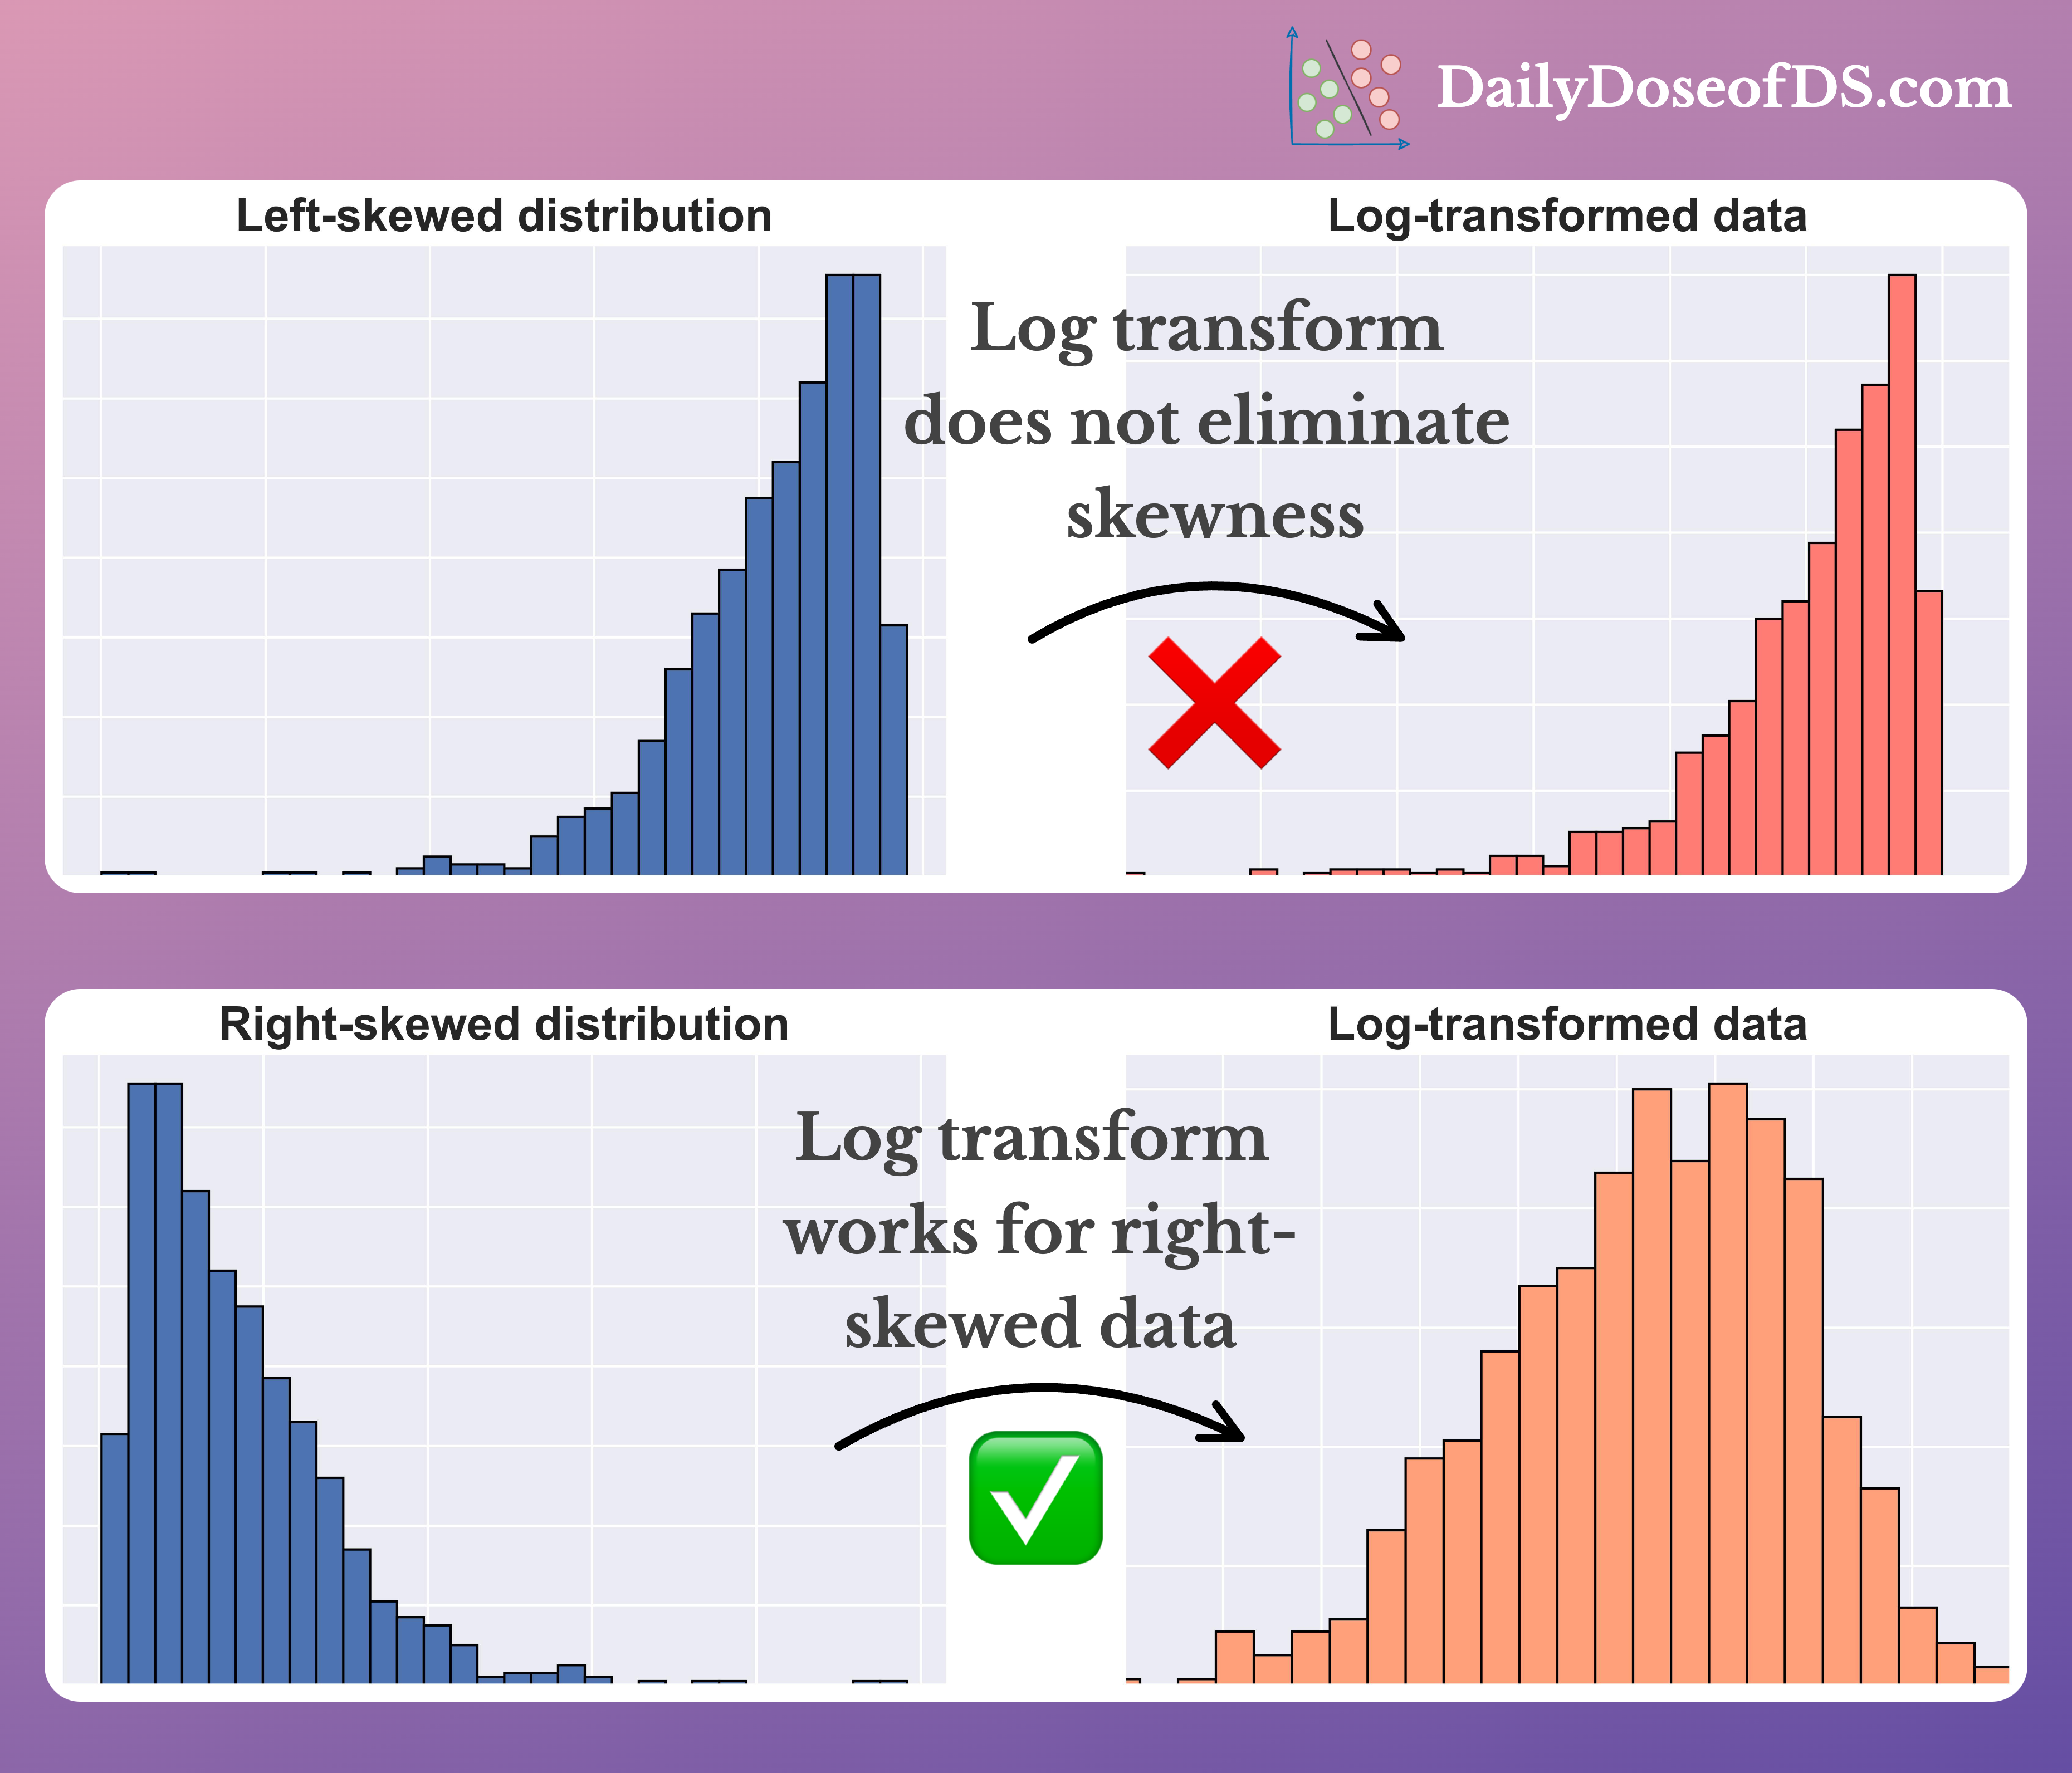
The intuition is that the logarithm function "squashes" the scale of the data. The effect is much more pronounced on large numbers than on small ones. For instance, the difference between 1000 and 100 is 900, but the difference between log(1000) and log(100) is much smaller (approx. 6.9 vs 4.6). This pulls the long right tail inwards, making the distribution more symmetrical.
A Practical Challenge: Handling Zeros
There's a catch: the logarithm function, log(x), is only defined for positive numbers (x > 0). It's undefined for zero and returns a complex number for negative values, which are not usable in most standard ML models. Since many real-world features (like "number of purchases") can contain zeros, we need a solution.
The standard workaround is the log(1+x) transformation. By adding 1 to every value before taking the log, you ensure that you are never trying to take the log of zero or a negative number (assuming your original data is non-negative). This transformation is so common that NumPy provides a dedicated function for it: np.log1p(), which computes log(1+x) with high numerical precision.
To get a solid grasp of this, let's turn to a short article that explains the log transform and its practical implementation.
Log Transformation for Skewed Data
This article from apxml.com provides a concise and practical guide to using log transformation, including the crucial log1p method for handling zeros.
Read the sections 'Addressing Skewness with Log Transformation', 'Handling Zero and Negative Values', and 'Implementation with NumPy and Pandas'. Focus on understanding why log1p is the preferred function when your data might contain zeros.
Here's how you would apply this in practice with Pandas and NumPy:
import pandas as pd
import numpy as np
import seaborn as sns
import matplotlib.pyplot as plt

# 1. Create some positively skewed data
np.random.seed(0)
skewed_data = np.random.exponential(scale=200, size=1000)
df = pd.DataFrame({'feature': skewed_data})

# 2. Check the original skewness and plot
original_skew = df['feature'].skew()
print(f"Original Skewness: {original_skew:.2f}")

sns.histplot(df['feature'], kde=True)
plt.title(f"Original Distribution (Skew: {original_skew:.2f})")
plt.show()

# 3. Apply the log1p transformation
df['feature_log_transformed'] = np.log1p(df['feature'])

# 4. Check the new skewness and plot
transformed_skew = df['feature_log_transformed'].skew()
print(f"Transformed Skewness: {transformed_skew:.2f}")

sns.histplot(df['feature_log_transformed'], kde=True)
plt.title(f"Log Transformed Distribution (Skew: {transformed_skew:.2f})")
plt.show()
When you run this code, you'll see the original skewness is high (around 2.0), and the histogram has a long right tail. After the np.log1p transformation, the new skewness will be much closer to 0, and the histogram will look much more like a symmetrical bell curve.
Test your understanding!
You are preprocessing a dataset that includes a feature YearsSinceLastPromotion. This feature has values ranging from -5 to 20, where -5 indicates the person was demoted 5 years ago. The distribution is highly skewed.
Would np.log1p() be an appropriate transformation for this feature? Why or why not? What might be a more suitable alternative?
Show answer
No, np.log1p() would not be appropriate.
Reasoning: The log1p function calculates log(1+x). If x is -5, this would result in log(-4), which is undefined for real numbers. The log transformation (even with the 1+x adjustment) cannot handle negative input values.
Alternative: A more suitable alternative would be the Yeo-Johnson transformation. As you'll see in the next section, this transformation is designed to work with data that includes both positive and negative values.
3. A Broader View of Transformation Techniques
While the log transform is your go-to for positive skew, it's not the only tool available. Different situations might call for different methods. Let's briefly explore some other common transformations.
The following article from Machine Learning Mastery is an excellent, comprehensive guide. We will focus on the sections that introduce the different strategies.
Skewness Be Gone: Transformative Tricks for Data Scientists
This article provides a detailed overview of various transformation techniques for both positive and negative skew. We'll use it to survey the landscape of available methods.
First, read the section 'Strategies for Taming Positive Skewness'. This will introduce you to Square Root, Box-Cox, and Yeo-Johnson transformations. Then, read 'Strategies for Taming Negative Skewness' to see how squared and cubed transformations can be used. Don't worry about memorizing the code; focus on what each transformation does.
To see some of these transformations in action, let's revisit the AnalytiCode video.
📉 Fix Skewed Data in Python: 5 Transformations You Should Know!
This video demonstrates how to apply several transformations and compare their effectiveness in reducing skewness.
Watch the demonstrations of the Square Root (03:51 - 05:07), Log (06:39 - 07:43), and Yeo-Johnson (07:43 - 10:06) transformations. Notice how the skewness value changes with each method.
Here's a quick summary of the key alternatives:
| Transformation | Best For | Key Characteristics |
|---|---|---|
Square Root (np.sqrt) |
Moderate positive skew | A gentler transformation than log. Also requires non-negative data. |
Box-Cox (scipy.stats.boxcox) |
Positive skew | A powerful, parameterized transformation that automatically finds the best power transform. Requires data to be strictly positive. |
Yeo-Johnson (scipy.stats.yeojohnson) |
Positive or negative skew | A more flexible version of Box-Cox that can handle zero and negative values. An excellent general-purpose choice. |
Squared/Cubed (x**2, x**3) |
Moderate negative skew | These transformations can help correct left-skewed data by spreading out the lower values. |
Conclusion
You've now added another crucial technique to your data preprocessing toolkit. By identifying and correcting skewed distributions, you can satisfy the assumptions of many machine learning models and often improve their predictive performance.
Key Takeaways:
- Skewness measures the asymmetry of a feature's distribution and can negatively affect model performance.
- The most common type is positive (right) skew, where a long tail of high values pulls the mean to the right.
- The log transformation is a powerful method for correcting positive skew. Use
np.log1p()to handle data that includes zeros. - Log transforms are not suitable for data with negative values.
- For more flexibility, consider the Yeo-Johnson transformation, which works on positive, zero, and negative values, or the Box-Cox transformation for strictly positive data.
- The best transformation is often found through experimentation. Always visualize the distribution before and after to confirm its effect.
Preview of the Next Lesson:
So far, we have focused on cleaning and preparing existing features. But what if we could create entirely new features from the ones we already have? In our next lesson, we will dive into feature engineering, where you will learn how to create new features from existing data (e.g., interaction terms) to potentially unlock even better model performance.