Hello! Welcome to your next lesson in our journey through data preparation.
In our last few lessons, you've learned how to clean and prepare existing data—scaling numerical features, encoding categorical ones, and transforming skewed distributions. These are all forms of feature transformation. Today, we move from transforming features to creating them. This process is a core part of what's called feature engineering.
The goal of today's lesson is to learn how to create new features from existing data (e.g., interaction terms). Why is this so important? Because a machine learning model can only learn from the information you provide it. By creating new features, you can make underlying patterns and relationships in the data more explicit, which can dramatically boost your model's predictive power.
We'll explore several powerful techniques for creating new features, which can be broadly grouped into a few categories.
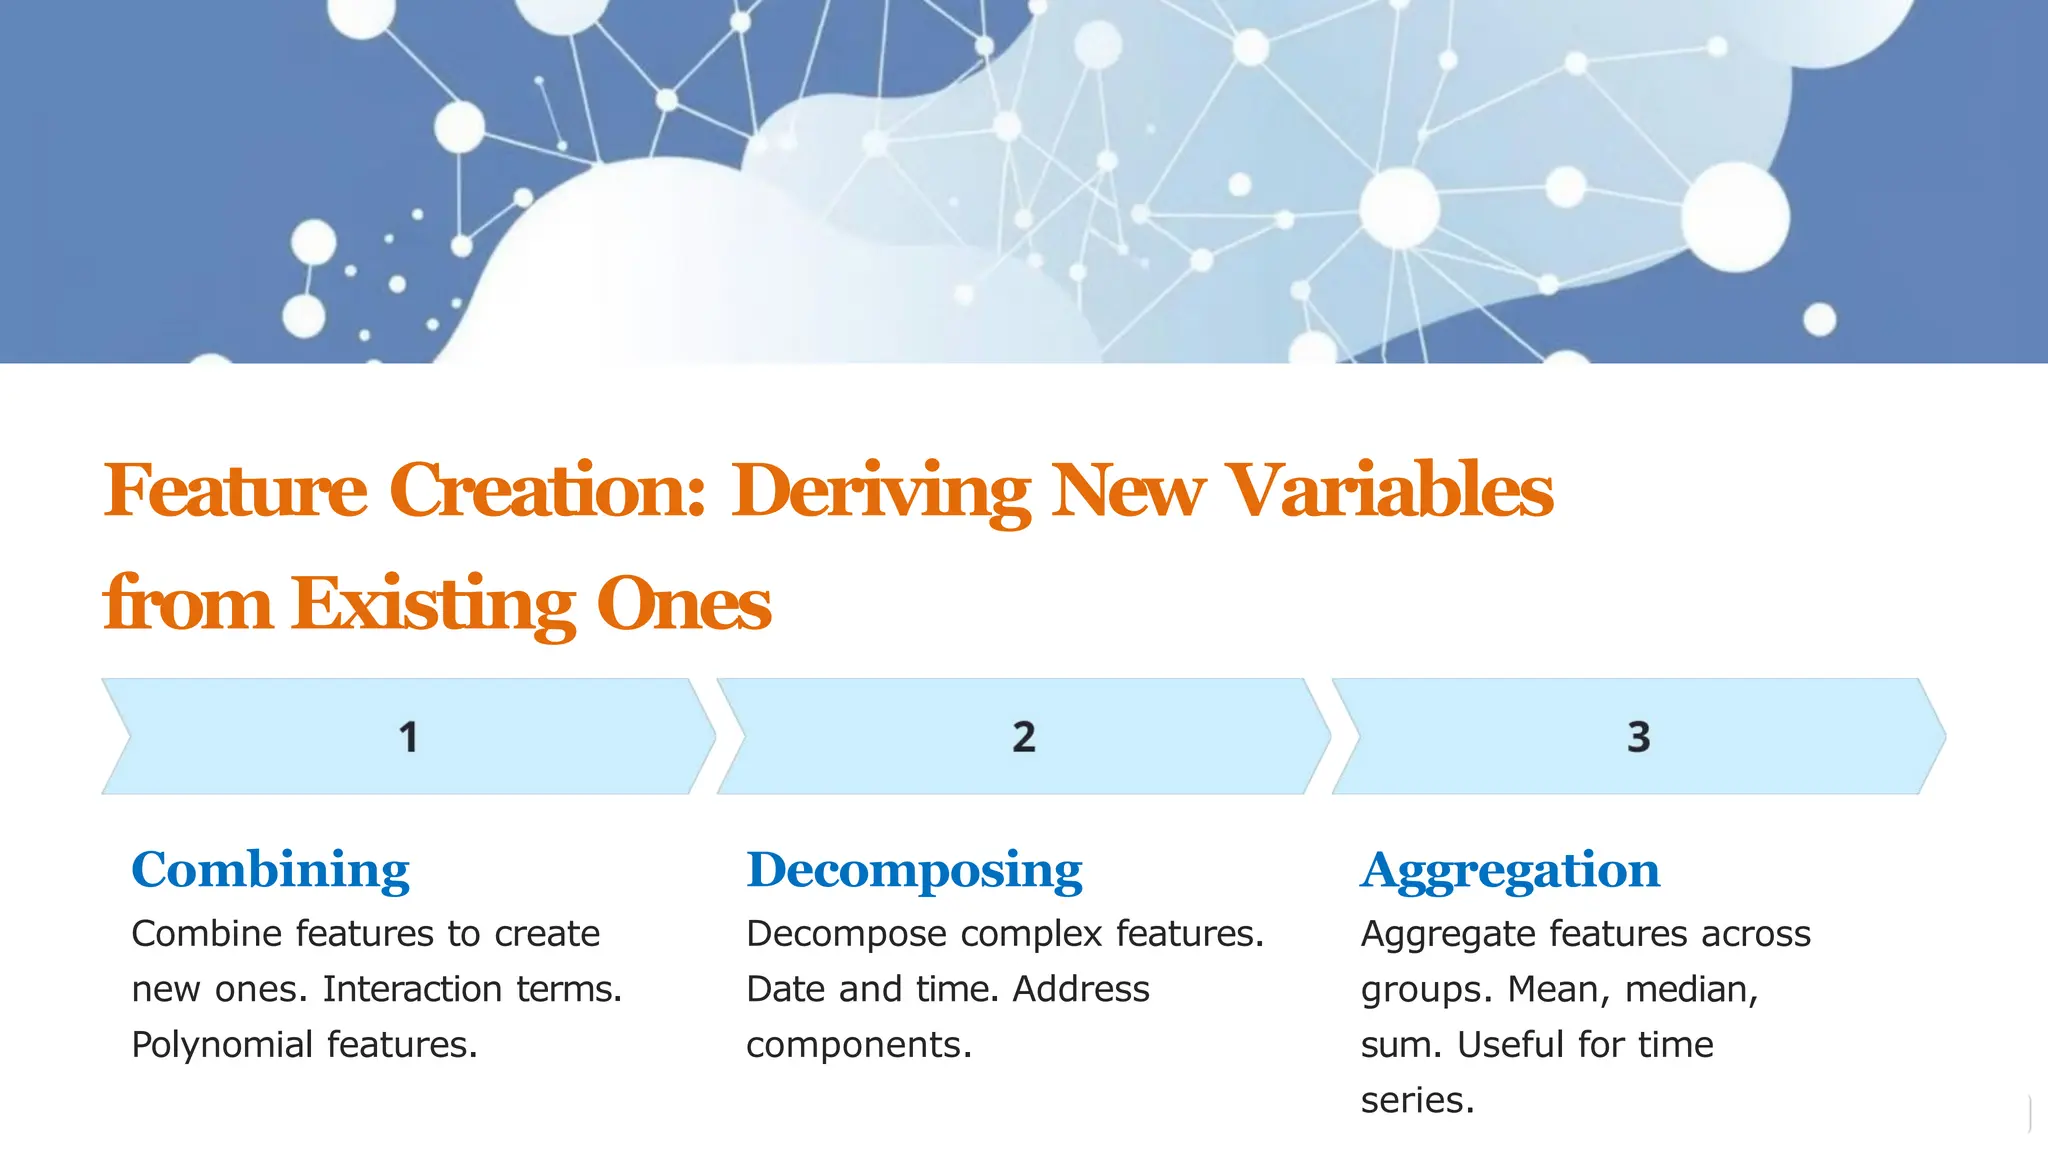
1. Creating Features with Domain Knowledge and Simple Arithmetic
Often, the most impactful new features come from a simple understanding of the data and the problem you're trying to solve. This might involve combining features with basic math (addition, subtraction, multiplication, division) to create a new variable that is more meaningful than its parts.
Let's watch a video that shows some excellent, intuitive examples of this.
Feature Engineering Full Course - in 1 Hour | Beginner Level
The 'Feature Engineering Full Course' video by Analytics Vidhya provides clear, practical examples of creating new features using domain knowledge on real-world datasets like the Titanic and a loan prediction dataset.
Please watch two segments: From 05:17 to 07:56: This part demonstrates creating 'family size' from two other columns in the Titanic dataset and extracting a 'product type' from an item ID. From 39:56 to 43:12: This segment shows how to create 'total income' by adding two income columns and a 'loan to income ratio' for a loan prediction task. Focus on how simple logic can create features that are likely more predictive for a model.
As you saw in the video, these new features are often more directly related to the problem.
FamilySizeis likely more predictive of survival on the Titanic than the number of siblings and parents separately.TotalIncomeis a more complete measure of a household's ability to repay a loan than just the applicant's income.
Here's how you can implement these ideas directly in Python using Pandas. It's often as simple as applying an arithmetic operation to existing columns.
import pandas as pd
import numpy as np

# Example 1: Creating 'TotalIncome' and 'LoanIncomeRatio'
# Let's create a sample DataFrame similar to the loan dataset
loan_data = {
    'ApplicantIncome': [5000, 6000, 3000, 4000],
    'CoapplicantIncome': [2000, 0, 1500, 5000],
    'LoanAmount': [150, 100, 100, 200]
}
df_loan = pd.DataFrame(loan_data)

# Create a 'TotalIncome' feature
df_loan['TotalIncome'] = df_loan['ApplicantIncome'] + df_loan['CoapplicantIncome']

# Create a 'LoanIncomeRatio' feature
# Adding a small constant to the denominator to avoid division by zero
df_loan['LoanIncomeRatio'] = df_loan['LoanAmount'] / (df_loan['TotalIncome'] + 1e-6)

print("Loan DataFrame with new features:")
print(df_loan)
This approach is powerful because it allows you to inject your understanding of the real world into the dataset.
2. Capturing Relationships: Interaction Terms & Polynomial Features
Sometimes, the effect of one feature depends on the value of another. For example, the positive effect of fertilizer on crop yield might only occur if there is also enough rainfall. A linear model struggles to learn this "if-then" relationship on its own.
An interaction term, created by multiplying two or more features together, makes this combined effect explicit. This allows a model to learn that fertilizer * rainfall is a potent combination.
Let's start with a video that clearly explains the "why" behind interaction features.
Create feature interactions using PolynomialFeatures
This video from Data School gives a very concise and clear explanation of what feature interactions are and why they are useful, especially for linear models.
Watch the first part of the video, from 00:16 to 01:31. Focus on the core idea: interaction features are useful when the combined impact of features is different from their individual impacts.
To formalize this and see how to implement it, we'll turn to a textual resource and scikit-learn's PolynomialFeatures transformer. This powerful tool can create both interaction terms and polynomial features (e.g., , ), which help models capture curved, non-linear relationships.
Interaction Terms and Polynomial Features
The article 'Interaction Terms and Polynomial Features' provides a solid theoretical background and practical code for using scikit-learn to generate these features.
Please read the first three sections: the introduction, 'Polynomial Features: Capturing Non-Linearity', and 'Interaction Terms: Capturing Dependencies'. Pay close attention to the code examples and the distinction between setting interaction_only=True versus the default behavior.
Now that you have the theory, let's see PolynomialFeatures in action.
Create feature interactions using PolynomialFeatures
Let's return to the Data School video to see a practical demonstration of using PolynomialFeatures and discuss when to use this technique.
Watch the rest of the video (from 01:31 to 03:59). The first part shows the code, and the second part discusses an important strategic point: tree-based models can learn interactions implicitly, making this technique most valuable for linear models.
Here's a summary of the implementation in Python. Notice how we can control whether we get only interactions or full polynomial features.
from sklearn.preprocessing import PolynomialFeatures

# Sample data with two features
X = np.array([[2, 3],
              [4, 5],
              [6, 7]])
features_df = pd.DataFrame(X, columns=['x1', 'x2'])
print("Original Features:")
print(features_df)

# 1. Interaction terms only
# This creates the original features plus the interaction term (x1 * x2)
poly_interact = PolynomialFeatures(degree=2, interaction_only=True, include_bias=False)
X_interact = poly_interact.fit_transform(X)

# Get feature names for clarity
interact_names = poly_interact.get_feature_names_out(['x1', 'x2'])
interact_df = pd.DataFrame(X_interact, columns=interact_names)

print("\nFeatures with Interactions Only:")
print(interact_df)


# 2. Full polynomial features (degree 2)
# This creates original features, interaction term (x1*x2), and squared terms (x1^2, x2^2)
poly_full = PolynomialFeatures(degree=2, interaction_only=False, include_bias=False)
X_full = poly_full.fit_transform(X)

# Get feature names for clarity
full_names = poly_full.get_feature_names_out(['x1', 'x2'])
full_df = pd.DataFrame(X_full, columns=full_names)

print("\nFeatures with Full Polynomials (degree=2):")
print(full_df)
A key takeaway is that while these features can be very powerful, they also increase the complexity of your model and the risk of overfitting. It's crucial to start with a low degree (like 2) and be mindful of the number of features you're creating.
Test your understanding!
You have a dataset with three features: temperature, humidity, and wind_speed. You use PolynomialFeatures(degree=2, interaction_only=True, include_bias=False).
What new features will be generated, in addition to the original three?
Show answer
Since interaction_only is True and the degree is 2, scikit-learn will generate all pairwise multiplication features. The new features will be:
temperature * humiditytemperature * wind_speedhumidity * wind_speed
It will not create squared terms like temperature^2 because interaction_only is set to True.
3. Decomposing Complex Features: The Case of Datetime
Some features, like a timestamp, contain a wealth of information packed into a single column. "Decomposing" such a feature means breaking it down into its constituent parts, each becoming a new feature.
A timestamp like 2023-10-27 15:30:00 can tell you:
- Year: 2023
- Month: 10 (October)
- Day of month: 27
- Day of week: 4 (Friday)
- Hour: 15 (3 PM)
- Is it a weekend? No.
- Is it the end of the month? Yes.
Each of these could be a valuable signal for a machine learning model. Pandas makes this decomposition incredibly easy using the .dt accessor.
Feature Engineering Full Course - in 1 Hour | Beginner Level
Let's revisit the Analytics Vidhya course to see a detailed walkthrough of how to extract a wide variety of features from a datetime column.
Watch the segment from 49:17 to 55:10. This part explains why datetime features are useful and demonstrates the practical steps in Python using the .dt accessor to extract year, month, hour, day of the week, and more.
Let's put that into a clean code example. The key is to first ensure your column is in a proper datetime format using pd.to_datetime().
# Create a sample DataFrame with date strings
date_data = {'event_time': ['2023-01-15 08:30:00', '2023-07-22 21:00:00', '2024-12-25 12:00:00']}
df_dates = pd.DataFrame(date_data)

# 1. Convert the column to datetime objects
df_dates['event_time'] = pd.to_datetime(df_dates['event_time'])
print("Original DataFrame with correct dtype:")
print(df_dates.info())

# 2. Decompose the datetime into new features
df_dates['year'] = df_dates['event_time'].dt.year
df_dates['month'] = df_dates['event_time'].dt.month
df_dates['day_of_week'] = df_dates['event_time'].dt.dayofweek # Monday=0, Sunday=6
df_dates['hour'] = df_dates['event_time'].dt.hour
df_dates['is_weekend'] = df_dates['event_time'].dt.dayofweek.isin([5, 6]).astype(int)

print("\nDataFrame with new datetime features:")
print(df_dates)
Conclusion
Congratulations! You've just learned the fundamentals of feature engineering, a skill that separates good machine learning practitioners from great ones. You now have a range of techniques to create new, potentially powerful features from the data you already have.
Key Takeaways:
- Feature Engineering is the process of creating new features to improve model performance. It's as much an art as it is a science.
- New features can be created through:
- Domain Knowledge: Using simple arithmetic (
+,-,*,/) to combine features in a way that makes real-world sense (e.g.,TotalIncome). - Interaction Terms: Multiplying features to help linear models capture combined effects (e.g.,
temperature * humidity).PolynomialFeaturesis the tool for this. - Decomposition: Breaking down complex features like datetimes into simpler parts (e.g.,
year,month,hour) using tools like Pandas'.dtaccessor.
- Domain Knowledge: Using simple arithmetic (
Preview of the Next Lesson:
We've now covered all the key individual steps of data preparation: scaling, encoding, transforming, and creating features. But how do you put them all together in an organized, efficient, and reproducible way? In our next lesson, you will learn how to build a data preprocessing pipeline using scikit-learn's Pipeline and ColumnTransformer. This is the final step in creating a professional machine learning workflow.