Hello! Welcome to the fifth module of our course, "Data Visualization and Preparation."
In the previous modules, you've become proficient in manipulating data using NumPy and Pandas. You can now load, clean, filter, group, and combine datasets. But raw numbers in tables can only tell you so much. To truly understand your data and uncover the stories hidden within it, you need to visualize it. Data visualization is a critical first step in any machine learning project for exploring data, identifying patterns, and communicating your findings.
This lesson introduces the foundational plotting library in Python: Matplotlib. We'll focus on creating three of the most common and useful plot types:
- Line plots, to track trends over time.
- Scatter plots, to investigate relationships between variables.
- Histograms, to understand the distribution of a single variable.
By the end of this lesson, you'll be able to turn your Pandas DataFrames and other data structures into insightful basic visualizations.
1. Getting Started with Matplotlib
Matplotlib is a comprehensive library for creating static, animated, and interactive visualizations in Python. The part of the library we'll use most often is pyplot, which provides a simple interface for creating plots. By convention, it's imported with the alias plt.
The basic workflow for creating a plot in Matplotlib is:
- Prepare your data (e.g., using Python lists or Pandas Series).
- Create a plot using a
pltfunction (e.g.,plt.plot()). - Customize the plot with labels, titles, colors, etc.
- Display the plot using
plt.show().
Let's start with a video that introduces Matplotlib and demonstrates this basic workflow.
Matplotlib Plot Tutorial: Histograms, Scatter Plots & Legend
This video from DataCamp provides a great introduction to why we visualize data and how to create a simple plot with Matplotlib. It covers the essential import statement and the use of plt.show().
Watch from the beginning (00:22) to 03:08. Pay attention to the standard import convention and the roles of plt.plot() and plt.show().
2. Line Plots: Visualizing Trends
As you saw in the video, a line plot is ideal for showing how a numerical value changes over a continuous sequence, most often time. It connects a series of data points with a line, making it easy to see trends, increases, and decreases.
The core function is plt.plot(x_values, y_values).
Let's take the example from the video and add some essential customizations. A plot is not complete without clear labels and a title. These give context to the viewer.
import matplotlib.pyplot as plt

# Sample data: population (in billions) over years
year = [1950, 1970, 1990, 2010]
pop = [2.519, 3.692, 5.263, 6.972]

# 1. Create the plot
plt.plot(year, pop)

# 2. Add customizations
plt.title("World Population Growth")
plt.xlabel("Year")
plt.ylabel("Population (Billions)")

# 3. Display the plot
plt.show()
Running this code will produce a line plot with a title and labeled axes, making it much more informative. For more advanced customization, you can control the line's color, style, and markers.
# Re-plotting with style customizations
plt.plot(year, pop, color='green', marker='o', linestyle='--')

plt.title("World Population Growth")
plt.xlabel("Year")
plt.ylabel("Population (Billions)")
plt.show()
Here, color='green' sets the line color, marker='o' adds a circle at each data point, and linestyle='--' creates a dashed line.
3. Scatter Plots: Exploring Relationships
While line plots connect sequential points, scatter plots display individual data points to show the relationship between two numerical variables. They are fundamental in data exploration for machine learning, as they can help you spot correlations, clusters, and potential outliers between features.
The function for this is plt.scatter(x_values, y_values).
Let's say we have data on the heights and weights of a group of people. A scatter plot is the perfect tool to see if there's a relationship between these two measurements.
# Sample data: height (cm) and weight (kg)
height = [151, 174, 138, 186, 128, 136, 179, 163, 152, 131]
weight = [63, 81, 56, 91, 47, 57, 76, 72, 62, 48]

# Create the scatter plot
plt.scatter(height, weight)

# Add labels and title
plt.title("Height vs. Weight")
plt.xlabel("Height (cm)")
plt.ylabel("Weight (kg)")

plt.show()
You'll notice the points tend to go up and to the right, suggesting a positive correlation: taller people tend to be heavier. This is the kind of initial insight visualization provides.
A powerful technique is to use color to represent a third, categorical variable, which can reveal deeper patterns. The tutorial below demonstrates this well using the famous Iris dataset.
The Hex Technologies tutorial 'Create basic Matplotlib plots' provides an excellent example of creating a scatter plot and color-coding it by category. This is a common and powerful technique in data analysis.
Read the section 'Scatter plot'. Focus on the second code block, where they loop through the unique classes of the Iris dataset to plot each with a different color and marker. This demonstrates how to encode a third variable into a 2D plot.
Test your understanding!
You are given a line plot showing a company's monthly revenue over a year. Your manager finds the connecting lines misleading because sales are only recorded at the end of each month, not continuously. They just want to see the revenue value for each month as a distinct point.
Which function would you switch to, and why?
Show answer
You would switch from plt.plot() to plt.scatter(). A scatter plot will display each month's revenue as a discrete point without connecting them, accurately reflecting that the data represents monthly totals, not a continuous flow. This avoids the misleading impression of a continuous trend between the end-of-month data points.
4. Histograms: Understanding Distributions
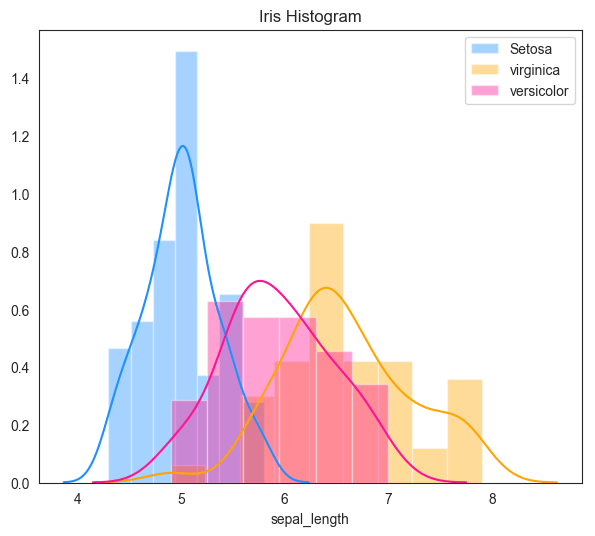
Our first two plots showed relationships between variables. A histogram, however, is used to understand the distribution of a single numerical variable. It groups numbers into ranges (called "bins") and the height of the bar shows how many data points fall into that range.
Histograms are essential for:
- Seeing the "shape" of your data (e.g., is it symmetric, skewed?).
- Identifying the central tendency (where most of the data is clustered).
- Spotting gaps or potential outliers.
In machine learning, understanding feature distributions is crucial for deciding on preprocessing steps like scaling or transformation.
The main function is plt.hist(data, bins=N), where N is the number of bins you want to divide the data into. Choosing the right number of bins is important—too few can hide patterns, and too many can create a noisy, uninformative plot.
Let's watch a video that explains histograms in detail, from the concept of bins to plotting data from a Pandas DataFrame.
Matplotlib Tutorial (Part 6): Histograms
This tutorial by Corey Schafer is a comprehensive guide to creating histograms. It clearly explains what bins are and shows how to customize them for more interpretable plots.
Watch from the beginning (00:00) to 07:22. The first part explains the concept of bins using a simple list. The second part shows how to define your own bin edges for more control, which is a very useful skill.
As the video demonstrated, you have fine-grained control over how your data is binned. Let's create a simple histogram with a list of data.
import numpy as np

# Generate some sample data (e.g., test scores)
# np.random.randn() creates numbers from a standard normal distribution
scores = 80 + 10 * np.random.randn(1000)

# Create the histogram
plt.hist(scores, bins=30, edgecolor='black') # Using 30 bins and adding edge colors for clarity

# Add labels and title
plt.title("Distribution of Test Scores")
plt.xlabel("Score")
plt.ylabel("Frequency")

plt.show()
This plot will show you the frequency of scores across different ranges, likely revealing a "bell curve" shape, indicating that most scores are clustered around the average (80).
Conclusion
Congratulations! You've taken your first steps into the world of data visualization with Python. You now have the tools to create the three most fundamental types of plots.
Key Takeaways:
- Matplotlib (
pyplot) is the foundational library for plotting in Python. The standard workflow is toplot,customize, and thenshow. - Line Plots (
plt.plot): Use these to visualize trends in data over a continuous interval, like time. - Scatter Plots (
plt.scatter): Use these to investigate the relationship and correlation between two numerical variables. - Histograms (
plt.hist): Use these to understand the shape, center, and spread of the distribution of a single numerical variable.
Preview of the Next Lesson:
Matplotlib is incredibly powerful but can sometimes require a lot of code for complex or aesthetically refined plots. In our next lesson, we will explore Seaborn, a high-level library built on top of Matplotlib. You'll see how Seaborn can help you create beautiful and complex statistical plots, like box plots and heatmaps, with much less code, further enhancing your ability to explore and understand your data.