Hello! Welcome to the final lesson in our module on classification models.
In our last session, we took a deep dive into the confusion matrix, learning how to break down a model's performance into True Positives, True Negatives, False Positives, and False Negatives. This gave us a detailed snapshot of performance at a single, fixed classification threshold (usually 0.5).
But what if 0.5 isn't the best threshold for our problem? And how can we evaluate a model's overall ability to distinguish between classes, independent of any specific threshold? This lesson will answer those questions.
Today, you will learn to plot and interpret Receiver Operating Characteristic (ROC) curves and calculate the Area Under the Curve (AUC). These are some of the most widely used tools for evaluating and comparing the performance of binary classifiers, providing a more complete picture than the single-point evaluation of a confusion matrix.
From Confusion Matrix to ROC Metrics
Let's quickly recap. The confusion matrix gives us four numbers. From these, we can calculate two crucial rates:
-
True Positive Rate (TPR): This is also known as Sensitivity or Recall. It answers the question: Of all the actual positive instances, what proportion did our model correctly identify?
-
False Positive Rate (FPR): This answers the question: Of all the actual negative instances, what proportion did our model incorrectly label as positive?
The core idea of an ROC curve is to see how these two rates trade off against each other as we change our classification threshold.
The Role of the Classification Threshold
Most classification models, like the LogisticRegression we've used, don't just output a hard prediction (0 or 1). Instead, they output a probability score between 0 and 1. We then use a threshold to make the final call. For example:
- If
probability > 0.5, predict1(positive). - If
probability <= 0.5, predict0(negative).
But what happens if we change this threshold?
- A very low threshold (e.g., 0.1) will classify more instances as positive. This will increase our TPR (we catch more true positives) but also likely increase our FPR (we get more false alarms).
- A very high threshold (e.g., 0.9) will be very conservative, classifying fewer instances as positive. This will decrease our FPR (fewer false alarms) but also likely decrease our TPR (we miss more true positives).
To understand this crucial concept visually, let's turn to a fantastic explanation from StatQuest.
ROC and AUC, Clearly Explained!
The video 'ROC and AUC, Clearly Explained!' provides an intuitive walkthrough of how changing the classification threshold affects our model's predictions and leads to the metrics needed for an ROC curve.
Watch the video from 00:48 to 08:34. The first part explains how different thresholds impact classification results. The second part defines the True Positive Rate and False Positive Rate, which are the axes of the ROC curve.
Building and Interpreting the ROC Curve
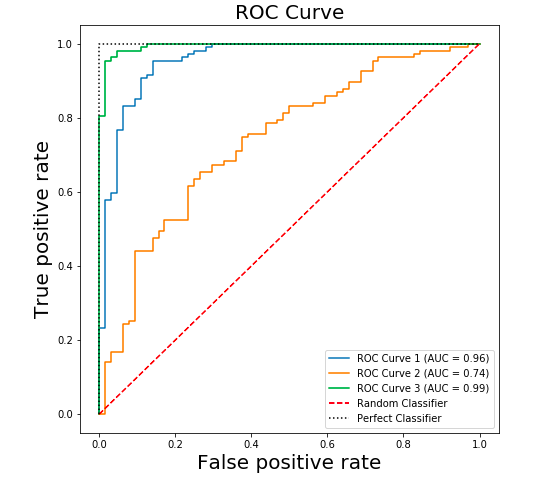
The Receiver Operating Characteristic (ROC) curve is a graph that visualizes this trade-off. It plots the True Positive Rate (y-axis) against the False Positive Rate (x-axis) for every possible classification threshold.
Let's continue with the StatQuest video to see exactly how these points come together to form a curve.
ROC and AUC, Clearly Explained!
This next segment shows how the (FPR, TPR) pairs calculated at different thresholds are plotted to create the full ROC curve.
Watch from 08:34 to 13:38. Pay close attention to how each point on the curve corresponds to a specific threshold and its associated confusion matrix.
After watching, you should understand these key features of the ROC space:
- The Diagonal Line (
y=x): This represents a model with no discriminative power—it's equivalent to random guessing. An ROC curve below this line means the model is performing worse than random. - The Top-Left Corner (FPR=0, TPR=1): This is the ideal point. It represents a perfect classifier that identifies all positive cases (TPR=1) without making any false positive errors (FPR=0).
- The Curve: A good model's ROC curve will "bow" up towards the top-left corner. The more it bows, the better the model's ability to distinguish between the positive and negative classes.
AUC: Summarizing Performance in a Single Number
Looking at a curve is insightful, but what if we want to compare two different models? It can be hard to tell which curve is "better" just by looking. This is where the Area Under the Curve (AUC) comes in.
The AUC is a single scalar value that measures the entire two-dimensional area underneath the ROC curve.
ROC and AUC, Clearly Explained!
This final clip from StatQuest explains what AUC is and how it's used to compare models.
Watch from 13:38 to 14:31 and the summary from 15:17 to 15:52. This explains how AUC provides a single score for comparing different ROC curves.
Here's how to interpret the AUC score:
- AUC = 1.0: Represents a perfect classifier.
- AUC = 0.5: Represents a model with no discriminative ability (equivalent to random guessing).
- AUC > 0.5: The model has some ability to distinguish between classes. A higher AUC generally indicates a better model.
- AUC < 0.5: The model is performing worse than random. This is rare, and often suggests an error in your code or that the model's predictions are inverted.
A useful intuitive interpretation is that the AUC is the probability that the model will rank a randomly chosen positive instance higher than a randomly chosen negative instance.
Test your understanding!
You have trained two models to predict customer churn (positive class = 'churn').
- Model A has an AUC of 0.85. Its ROC curve shows it can achieve a TPR of 0.90 with an FPR of 0.30.
- Model B has an AUC of 0.92. Its ROC curve shows the highest TPR it can achieve is 0.80.
The business decides it's absolutely critical to identify at least 90% of customers who will churn, even if it means sending retention offers to some customers who wouldn't have left. Which model should you choose, and why?
Show answer
You should choose Model A.
Even though Model B has a higher overall AUC (0.92 vs 0.85), the business has a specific requirement: a True Positive Rate of at least 0.90. Model B cannot meet this requirement at any threshold. Model A, despite its lower overall AUC, can be tuned to a threshold that meets the business's critical need.
This demonstrates that while AUC is a great general metric for model comparison, the specific shape of the ROC curve and the business context are also crucial for making the final decision.
Plotting ROC and AUC in Python
Now let's put this into practice. scikit-learn provides all the tools we need to easily generate ROC curves and calculate AUC scores for one or more models.
The article below provides a clear, step-by-step guide with code.
AUC and the ROC Curve in Machine Learning
The DataCamp article 'AUC and the ROC Curve in Machine Learning' walks through a full Python implementation, from generating data to plotting and comparing the ROC curves of multiple models.
Read the sections 'Creating a ROC curve' and 'Choosing the Best Algorithm using the ROC Curve'. Focus on the Python code blocks and the explanations for how to use roc_curve, roc_auc_score, and matplotlib to generate the plots.
Here is a consolidated code example based on the article that you can run. It trains a Logistic Regression and a Random Forest model and plots their ROC curves on the same graph for comparison.
import matplotlib.pyplot as plt
from sklearn.datasets import make_classification
from sklearn.model_selection import train_test_split
from sklearn.linear_model import LogisticRegression
from sklearn.ensemble import RandomForestClassifier
from sklearn.metrics import roc_curve, roc_auc_score

# 1. Generate a binary classification dataset
X, y = make_classification(n_samples=1000, n_features=20, n_classes=2, random_state=42)

# 2. Split into training and testing sets
X_train, X_test, y_train, y_test = train_test_split(X, y, test_size=0.3, random_state=42)

# 3. Define and train the models
models = {
    "Logistic Regression": LogisticRegression(),
    "Random Forest": RandomForestClassifier(random_state=42)
}

# 4. Plot the ROC curves
plt.figure(figsize=(10, 8))

for name, model in models.items():
    # Train the model
    model.fit(X_train, y_train)

    # **Key Step**: Get the probability scores for the positive class
    # The output of predict_proba is [prob_class_0, prob_class_1] for each sample.
    # We need the probabilities for the positive class (class 1).
    y_probs = model.predict_proba(X_test)[:, 1]

    # Calculate the ROC curve and AUC score
    fpr, tpr, thresholds = roc_curve(y_test, y_probs)
    auc_score = roc_auc_score(y_test, y_probs)

    # Plot the curve
    plt.plot(fpr, tpr, lw=2, label=f'{name} (AUC = {auc_score:.2f})')

# 5. Plot the random guessing line and customize the plot
plt.plot([0, 1], [0, 1], color='navy', lw=2, linestyle='--')
plt.xlim([0.0, 1.0])
plt.ylim([0.0, 1.05])
plt.xlabel('False Positive Rate')
plt.ylabel('True Positive Rate')
plt.title('ROC Curve Comparison')
plt.legend(loc="lower right")
plt.grid(True)
plt.show()
This code produces a single plot that lets you visually compare the performance of the two models across all thresholds, with their overall performance neatly summarized by the AUC score in the legend.
Conclusion
Congratulations on completing this lesson and the classification module! You now have a powerful and nuanced way to evaluate and compare your classification models.
Key Takeaways:
- ROC curves visualize the trade-off between the True Positive Rate (TPR) and False Positive Rate (FPR) across all possible classification thresholds.
- A model's performance is better the more its ROC curve "bows" towards the top-left corner (high TPR, low FPR).
- The Area Under the Curve (AUC) provides a single number from 0 to 1 to summarize a model's overall discriminative ability, making it excellent for model comparison. An AUC of 1.0 is perfect, while 0.5 is no better than random guessing.
- In Python, you use
model.predict_proba(),roc_curve(), androc_auc_score()fromscikit-learnto get the necessary data for plotting.
Preview of the Next Lesson:
We have now covered the essentials of Supervised Learning for both regression and classification. In the next module, we will venture into a different paradigm of machine learning: Unsupervised Learning. We will start by exploring a fundamental technique for Dimensionality Reduction called Principal Component Analysis (PCA), which helps us simplify and understand complex, high-dimensional datasets.