Hello! Welcome to the final lesson of our Unsupervised Learning module, and indeed, the final lesson of our entire course.
In the past few lessons, you've learned to implement three distinct clustering algorithms: K-means, Hierarchical Clustering, and DBSCAN. Each one groups data in a different way, but they all leave us with the same question: How good are the clusters we've created? Are they meaningful?
Today, we will answer that question. Our goal is to evaluate clustering quality using silhouette scores. This powerful metric helps us quantify how well-separated and compact our clusters are, moving us from a purely visual assessment to a quantitative one. It's a crucial step in building confidence in our unsupervised learning models.
Introduction: What Makes a "Good" Cluster?
At its heart, a good clustering result is one where the data points within a single cluster are very similar to each other (high cohesion) and very different from data points in other clusters (high separation).
The silhouette score is a metric designed to measure exactly this. It gives each data point a score, and the average score across all points tells us about the overall quality of our clustering. A higher average score generally indicates a better clustering result.
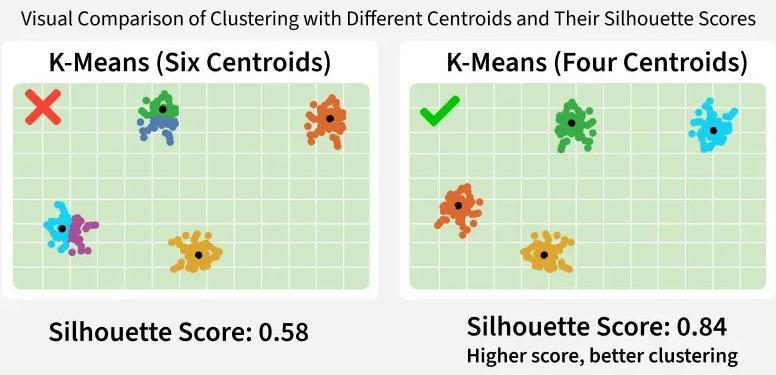
Look at the image below. It visually demonstrates this idea. The clustering on the right, which looks more natural and well-defined, has a significantly higher silhouette score.
Let's dive into how this score is actually calculated.
1. The Silhouette Score: Cohesion vs. Separation
For any single data point i, its silhouette score s(i) is calculated based on two values:
-
a(i): The Cohesion Term. This is the average distance from pointito all other points within the same cluster. A smalla(i)value means the point is well-placed within a dense, cohesive cluster. -
b(i): The Separation Term. This is the average distance from pointito all points in the nearest neighboring cluster. A largeb(i)value means the point is far away from other clusters, indicating good separation.
To get a clear, intuitive grasp of these two components, the following short video is excellent.
Silhouette Score for clustering Explained | Silhouette (clustering)- Validating Clustering Models
The video 'Silhouette Score for clustering Explained' by Unfold Data Science provides a simple, clear explanation of the cohesion (a) and separation (b) concepts.
Please watch from 0:41 to 5:59. The video breaks down how a(i) and b(i) are calculated for a single data point, providing a solid conceptual foundation.
The Formula
Once we have a(i) and b(i), the silhouette score for that single point i is calculated with this formula:
Let's break this down:
- Numerator
(b(i) - a(i)): We want separation (b) to be large and cohesion (a) to be small. A large, positive numerator indicates a well-clustered point. - Denominator
max{a(i), b(i)}: This term normalizes the score, ensuring it stays between -1 and +1.
Interpreting the Score
The value of the silhouette score tells you a lot about where a point sits in your clustered data:
- Score near +1: Indicates the point is far from neighboring clusters and very close to points in its own cluster. This is the ideal scenario. (
a(i) << b(i)) - Score near 0: Indicates the point is on or very close to the boundary between two clusters. (
a(i) ≈ b(i)) - Score near -1: Indicates the point is likely in the wrong cluster, as it is, on average, closer to points in a neighboring cluster than to points in its own. (
a(i) >> b(i))
To see the math and interpretation explained again with a slightly different visual approach, the following resource is very helpful.
Silhouette (clustering)- Validating Clustering Models- Unsupervised Machine Learning
The video 'Silhouette (clustering)' by Krish Naik walks through the steps of calculating a(i) and b(i) and explains the final formula and its interpretation.
Watch from 4:06 to 11:11. This segment reinforces the calculation steps and explains how the final score ranges from -1 to +1 and what those values mean.
Test your understanding!
You've run a K-means algorithm and are evaluating a specific data point, P. You find that its average distance to other points in its own cluster is a(P) = 0.5, and its average distance to the points in the nearest neighboring cluster is b(P) = 0.2.
- Without doing the exact calculation, what kind of silhouette score (positive, negative, or near zero) would you expect for point
P? - What does this score imply about how well
Phas been clustered?
Show answer
- Since
a(P)(cohesion distance) is greater thanb(P)(separation distance), the numeratorb(P) - a(P)will be negative. Therefore, the silhouette score forPwill be negative. - A negative score implies that point
Pis, on average, closer to the neighboring cluster than its own. This is a strong indication thatPhas likely been assigned to the wrong cluster.
2. Using Silhouette Scores to Find the Optimal k
One of the most common applications of the silhouette score is to help choose the optimal number of clusters, k, for an algorithm like K-means. The idea is simple: we can run K-means for several different values of k, calculate the average silhouette score for each result, and choose the k that gives the highest score.
In Python, this is made easy with scikit-learn's silhouette_score function.
The following article demonstrates this entire process. It uses a real dataset, iterates through different k values, and uses the silhouette score to find the best one.
K-Means Cluster Evaluation with Silhouette Analysis
The article 'K-Means Cluster Evaluation with Silhouette Analysis' from Machine Learning Mastery provides a great practical walkthrough.
Read the sections 'Introduction', 'Understanding the Silhouette Metric', and 'Silhouette Analysis in Action: The Penguins Dataset'. Pay close attention to the Python code that loops through a range of n_clusters, fits a K-means model, and calculates the silhouette_score for each.
As you saw in the article, the process is:
- Define a range of
kvalues to test (e.g., 2 to 10). - Loop through each
k. - Inside the loop, run
KMeanswith the currentk. - Get the
cluster_labelsfrom the fitted model. - Calculate the
silhouette_score(X_scaled, cluster_labels). - Compare the average scores and identify the
kthat produced the highest value.
3. Visual Analysis with Silhouette Plots
The average score is a useful summary, but we can get even more insight by creating a silhouette plot. This plot visualizes the silhouette score for every single sample in the dataset.
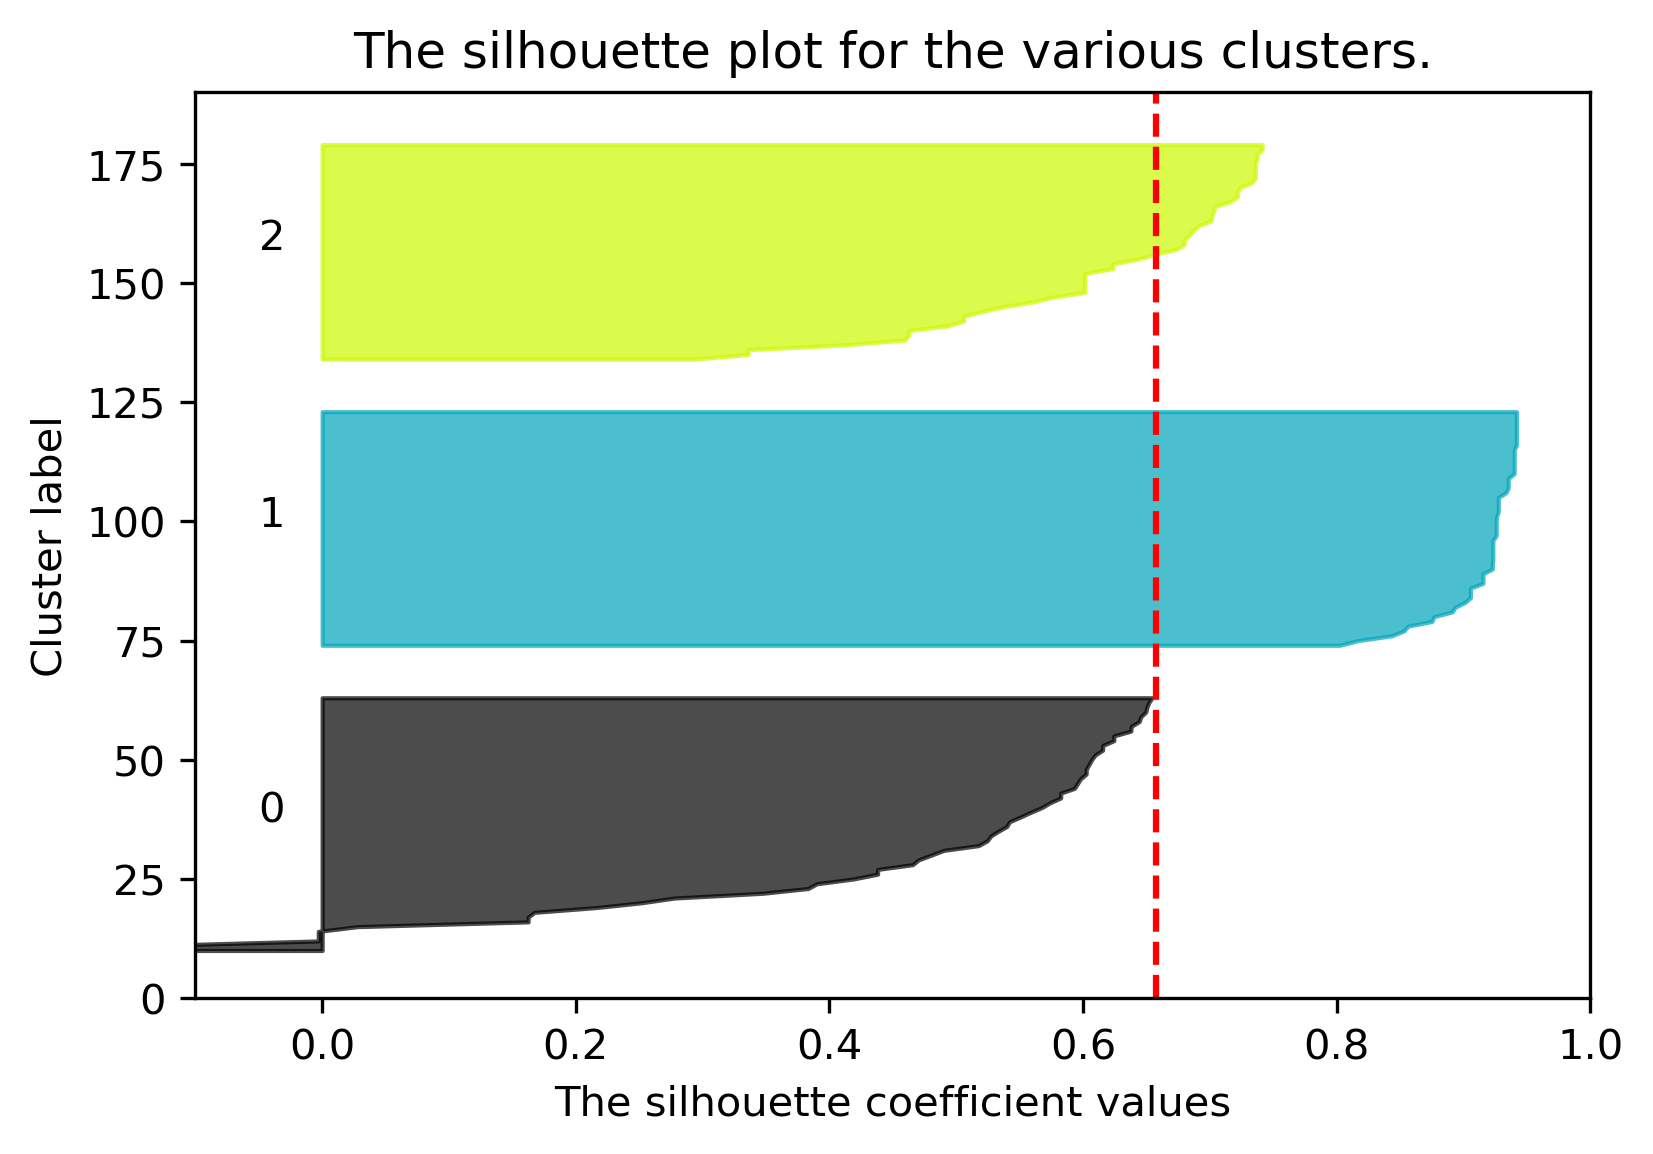
Here’s what to look for in a silhouette plot:
- Bar Length: Each horizontal bar is a data point. Longer is better.
- Cluster Quality: All bars for a given cluster should ideally be above the average score line (the red dashed line).
- Cluster Size: The thickness of the colored regions should be relatively uniform. A very thin "knife" shape indicates a small cluster.
- Negative Scores: The presence of bars extending to the left of zero (negative scores) indicates misclassified points.
To generate these plots, you use scikit-learn's silhouette_samples function, which returns the score for each individual sample.
The Krish Naik video and the Machine Learning Mastery article you've already seen both provide excellent code and interpretation for these plots. Let's focus on the code from the article to see how it's done.
K-Means Cluster Evaluation with Silhouette Analysis
Let's revisit the Machine Learning Mastery article to see the code for generating silhouette plots.
Focus on the final code block in the article, which begins with fig, axes = plt.subplots(...). This code generates the silhouette plots for each value of k that was tested. Trace how it uses silhouette_samples and then loops through each cluster to plot the sorted scores.
By analyzing these plots, you can diagnose your clustering results in detail. For example, if you run K-means with k=4 but the silhouette plot shows that one of the clusters has many points with low or negative scores, you know that particular cluster is not well-defined and those points might belong elsewhere. This is far more informative than just looking at the average score alone.
Conclusion and Course Wrap-Up
Congratulations! You've reached the end of the final lesson. Today, you learned how to quantitatively evaluate the quality of your clustering models, a critical skill for any unsupervised learning task.
Key Takeaways from this Lesson:
- The Silhouette Score measures cluster quality based on cohesion (
a(i), intra-cluster distance) and separation (b(i), nearest-cluster distance). - The score ranges from -1 (misclassified) to +1 (perfectly clustered), with 0 indicating an overlap between clusters.
- The average silhouette score is a powerful metric for choosing the optimal number of clusters (
k). - Silhouette plots provide a detailed visual diagnosis, showing the performance of individual points and the relative quality of different clusters.
- You can implement these evaluations easily in Python using
silhouette_scoreandsilhouette_samplesfromsklearn.metrics.
Reflecting on Your Journey
As this is our final lesson, let's take a moment to look back. Over the past 12 modules, you have built a formidable skill set. You started by strengthening your Python foundations with advanced techniques and Object-Oriented Programming. You then mastered the essential data science libraries—NumPy and Pandas—and learned to preprocess and visualize data with Scikit-learn, Matplotlib, and Seaborn.
After a targeted refresher on the core concepts of Linear Algebra and Calculus, you dived headfirst into machine learning. You learned to distinguish between different learning paradigms, handle the bias-variance tradeoff, and properly evaluate models. You built, trained, and interpreted supervised learning models for both regression and classification, and you have just finished a deep dive into unsupervised learning with three powerful clustering algorithms.
You have successfully progressed from an intermediate Python programmer to a capable, budding machine learning practitioner with a solid end-to-end understanding of the entire workflow.
What's Next?
Your goal is to become proficient in Python and machine learning, and this course has laid the foundation. The journey of learning never truly ends. Here are some potential next steps to continue your growth:
- Build a Portfolio: Apply your new skills to real-world datasets. Find interesting data on sites like Kaggle, Google Datasets, or government open data portals and try to solve a problem from start to finish.
- Enter a Competition: Participating in a Kaggle competition is one of the best ways to rapidly improve your skills.
- Explore Advanced Topics: You now have the background to explore more advanced areas like Natural Language Processing (NLP), Computer Vision, or Deep Learning with frameworks like TensorFlow or PyTorch.
Thank you for your dedication throughout this course. You have built a strong foundation, and I am excited to see what you will build with it. Happy coding