Recommended resources
The freely available resources this lesson will direct you to.
Hello! Last lesson distinguished training, batch inference, online prediction, and generative inference by when work happens and what resources it needs. The next step is to make phrases such as “fast recommendations” and “up-to-date results” precise enough to test.
This lesson develops a measurement contract for an AI product: what users need, which events to count, where to observe them, and what targets to set for availability, latency, throughput, freshness, and quality. The example continues the recommendation system from the previous lesson, including an optional generated explanation.
Begin with a user journey, not an infrastructure metric
Suppose the product requirement is:
While someone browses, show relevant recommendations quickly, taking recent activity into account. Offer an explanation of a recommended item on request. The experience must remain usable at peak traffic.
A GPU-utilization target would not tell us whether this requirement is met. Neither would a single “API uptime” number: the API could return promptly while serving stale features or poor recommendations.
First, identify the distinct user journeys. Viewing recommendations is a request-time prediction using recently prepared data. Requesting an explanation is generative inference with a potentially longer response. The data pipeline that makes recent activity available is another part of the experience, even though the user does not call it directly. Each journey needs a measurement boundary: for example, recommendation latency begins when an eligible request reaches the public ingress and ends when its response is delivered there.
Watch this short introduction to service-level indicators and objectives. Its emphasis on choosing a critical user journey before choosing a measurement point is the key idea to carry forward.
The Art of SLOs (Service Level Objectives)
Watch “The Art of SLOs (Service Level Objectives)” from Google Cloud Tech for a concise distinction between an indicator and a target.
Watch SLIs and SLOs for the definitions, then user journeys for the discussion of measurement boundaries and where to observe them. The game is an example; apply the method to a recommendation request.
An SLI is a measured indicator. An SLO states the level of that indicator the product aims to deliver over a specified window. An SLA, when one exists, is a separate agreement with another party; do not assume that every internal SLO is a contractual promise.
For the example, we will assume a peak demand of 600 recommendation requests per second for ten minutes and 20 explanation requests per second. These and the targets below are illustrative proposals, not values derivable from the vague product brief. Product needs, a traffic forecast, and baseline measurements must validate them.
Specify what counts before choosing a percentage
A useful SLI is often a ratio of good eligible events to all eligible events. That form forces important decisions into the open. Is a timed-out request eligible? Does a fast fallback recommendation count as a success? Does an invalid client request count against the service? For this example, an eligible request is a properly formed, authorized request within the agreed workload limits. Server errors, timeouts, and service-side rejections of those requests count as failures; malformed requests do not.
Read the SRE Workbook’s treatment of SLI specifications and implementations before looking at the proposed objectives. It separates the outcome you want to measure from the telemetry you actually have.
Read “Implementing SLOs” from the Google SRE Workbook to see how user-facing goals become counted events and measured targets.
In “What to Measure: Using SLIs,” read good-event ratios, including the examples of successful, fast, and fresh requests. Continue from the paragraph beginning “When attempting to formulate SLIs for the first time” through specification versus implementation. In “A Worked Example,” read the paragraph beginning “In order to capture both the typical user experience” through multiple thresholds. Then, under “Moving from SLI Specification to SLI Implementation” and “API and HTTP server availability and latency,” read from “For your first SLIs” through the explanation of why the example measures at the load balancer. Focus on what that measurement can and cannot see.
Here is a first measurement contract for the recommendation journey. A rolling 28-day window applies unless a row says otherwise.
| Objective | Proposed measurement and target |
|---|---|
| Availability | At least 99.9% of eligible recommendation requests return a usable response. Count server errors, timeouts, and service-side rejections as failures. |
| Latency | Of successful requests, at least 95% finish within 250 ms and 99% within 700 ms, measured at the public ingress. |
| Throughput | In a controlled test offering 600 eligible requests/s for ten minutes, with the agreed request mix, at least 99.9% succeed, and the latency targets still hold. Measure results against offered traffic, not just accepted traffic. |
| Freshness | At least 99% of eligible user-activity events become queryable by online scoring within two minutes of event creation. Events that never become queryable fail this measure. |
| Quality | At least 90% of a weekly random sample of 400 eligible generated explanations are supported by the item information available to the service, using a documented review rubric. |
These are not five synonyms for reliability. They expose different failure modes. A service may be available but slow; fast but unable to keep up with offered traffic; operationally healthy but using delayed activity; or technically successful while generating unsupported claims.
The denominator matters as much as the target. If a proxy sheds 100 requests before the model server sees them, model-server logs alone can report a perfect success rate. An ingress observation is closer to the user’s experience, though an ingress outage can itself prevent logging. External probes or client observations can help reveal that blind spot. Likewise, no observed traffic means an event-based ratio is undefined, not 100% available.
Availability, latency, and throughput answer different questions
Availability asks whether eligible requests receive usable results. With one million eligible requests in a 28-day window, a 99.9% availability objective permits at most 1,000 failed requests in that window. That is an error budget, not permission to disregard the pattern of failures: spending most of it during one ten-minute peak could be especially damaging.
Latency asks how long responses take. Defining it among successful requests keeps an outage from masquerading as a latency change: failed requests affect availability, while slow successful requests affect latency. The cost is that latency must never be reported alone. A combined “successful and fast” ratio is also useful as a direct user-experience measure, but it answers a different question. Two thresholds—95% within 250 ms and 99% within 700 ms—make the long tail visible without demanding the same speed from every request.
For generated explanations, “response latency” needs more care. A user may see text before generation finishes. A suitable first objective might be 95% of eligible explanation requests receive a first token within 1.5 seconds, measured from ingress, with a separate completion-time target for bounded prompt and output lengths. Define how failures and empty streams count. We will examine token-level serving performance later in the course; here, the point is to choose a boundary that reflects the actual experience.
Throughput asks whether the service can deliver results at the required arrival rate. Reporting “600 completed requests/s” is insufficient if 900 requests/s arrived and a queue is growing. A capacity objective therefore names the offered rate, duration, request mix, and accompanying success and latency conditions. The ten-minute test above should offer traffic steadily, count requests rejected before model execution, and allow each request its specified response deadline rather than declaring requests arriving in the last second failures merely because the test clock stopped.
Workload shape is part of this contract. “600 requests/s” means little if one test sends tiny inputs while production sends larger ones. For explanations, record prompt-length and output-length ranges alongside the 20 requests/s assumption; tokens/s may be a helpful capacity measurement, but it does not replace first-token and completion objectives. For batch inference, the corresponding product objective might instead be “99% of daily scoring runs publish at least 99.5% of eligible records by 06:00.” Its deadline and coverage matter more than per-request milliseconds.
A minimal implementation could emit one terminal record per eligible request at ingress:
request_id, journey, started_at, finished_at, outcome,
latency_ms, admitted, model_version, feature_version
Using those records, the two request SLIs remain deliberately separate:
In implementation, ensure timeouts and early rejections still produce an outcome record or are counted by another ingress counter. Segment the results by journey and, where meaningful, request size or service tier: a favorable aggregate can conceal a poor experience for a smaller but important group.
Freshness concerns the data the answer uses
Fast inference does not guarantee a current prediction. A recommendation can be calculated in 100 ms using activity from yesterday. Conversely, an activity event may have entered a stream promptly but still be waiting for a transformation or a serving-store write.
The pipeline image makes several useful clocks visible:
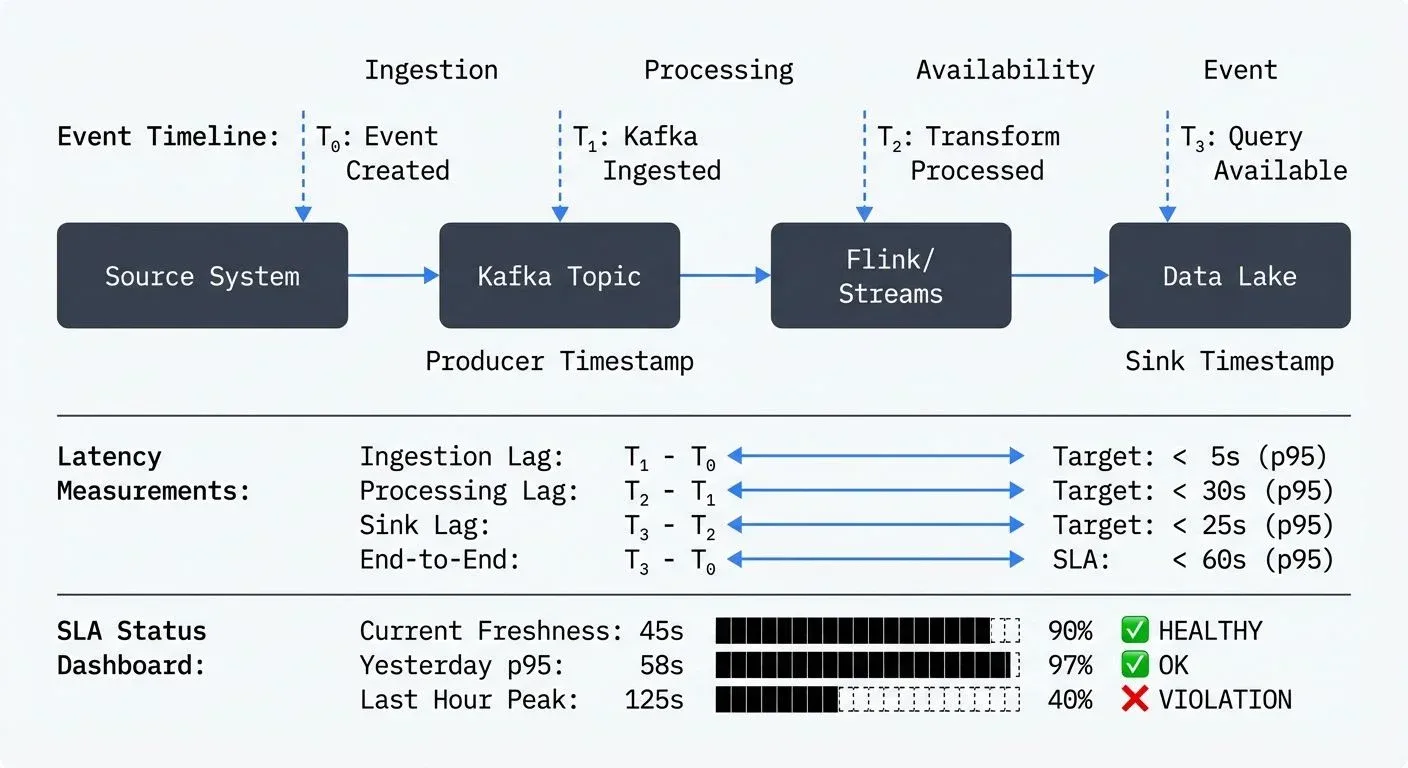
For the proposed freshness objective, record an event’s creation time and the time its processed value first becomes queryable by online scoring. Evaluate the fraction meeting the two-minute bound using a source-side ledger of eligible events. Measuring only events that successfully reach the final store would silently omit the very events that were lost. A never-published event should be counted as late once its deadline passes. Timestamp synchronization and the definition of “event creation” also need to be documented.
The diagram’s individual stage targets can help locate a delay, but stage percentiles do not automatically add up to an end-to-end percentile: different events can be slow at different stages. Measure the end-to-end objective directly.
There is also a distinction between event propagation delay and freshness experienced by a request. An event-to-queryable SLO verifies that the pipeline delivers recent activity. A complementary request-facing check can sample recommendation responses and inspect the feature snapshot or completeness watermark they used. That check is valuable if stale caches or serving-side retrieval can defeat an otherwise healthy pipeline. On an idle source, “time since the last event” is not by itself evidence of stale processing; a trustworthy watermark must account for what the source has actually produced.
Quality must describe a judged outcome
A valid HTTP response is not necessarily a useful AI result. The example’s explanation-quality objective therefore specifies what is judged (support in available item information), which outputs are eligible, how they are sampled, and how often the target is evaluated. A reviewer rubric should distinguish a supported statement, an unsupported claim, and an appropriate refusal. Reviewers should not be allowed to quietly replace failures with easier examples.
Read the short AI-focused material below for the connection between product outcomes and technical objectives, and for examples of data and model signals that ordinary service monitoring misses. Treat its named products as examples, not architectural requirements.
AI and ML perspective: Reliability | Cloud Architecture Center
Read “AI and ML perspective: Reliability” from the Google Cloud Architecture Center for AI-specific ways to turn product concerns into measurable service, data, and model behavior.
Under “Implement holistic AI and ML observability and reliability practices” and “Establish reliability goals and business metrics,” read product-to-metric mapping, then the following examples of quantified SLO targets. Under “Implement data and model observability,” read from data-quality signals and the passage beginning retrieval quality. Focus on the kinds of behavior measured rather than the suggested vendor tools.
For the recommendations themselves, a separate offline release gate could require a ranking metric such as NDCG at ten items to exceed an agreed threshold on a versioned, representative evaluation set. That is measurable, but it is not interchangeable with production quality: labels can become outdated, and the observed audience can change. A weekly reviewed sample provides a more direct—though slower and noisier—view of generated explanations. At 400 reviews, small changes around a 90% threshold warrant investigation rather than false precision; record sample size, selection method, and uncertainty alongside the headline percentage.
The same discipline applies to other AI products. “Good answers” might mean task completion, groundedness, acceptable harmful-output rate, or a combination. Choose a rubric linked to the user’s task, not a metric merely because it is easy to collect. Also distinguish a release acceptance threshold, evaluated before deployment, from an operational objective, evaluated on production behavior.
Make the contract usable
Before treating these proposals as commitments, review them with the people responsible for the product and its operation. For each objective, keep a short record of its user journey, eligible population, good-event rule, threshold, window, telemetry source, owner, and known blind spots. Then compare the targets with baseline traffic and user research, and run a representative load test. A target should reflect what users need and what the organization chooses to support—not simply the best number a current dashboard happens to show.
The five objectives also need to be read together. Caching might improve latency and throughput while harming freshness. Aggressive load shedding might protect latency among completed requests while reducing availability. A smaller or cheaper model might raise throughput while lowering judged quality. Making each effect measurable turns those choices into explicit product decisions.
Conclusion
To translate an AI requirement into an engineering objective, start with the user journey and define the events, boundaries, and workload conditions that matter. Availability counts usable outcomes; latency measures response timing; throughput tests capacity against offered work; freshness measures whether timely data reaches decisions; and quality judges whether the resulting decisions or outputs serve their purpose. Explicit denominators, windows, and measurement locations make each target testable—and expose where telemetry might mislead you.
Next, you’ll trace the data, artifact, and control flows through an end-to-end AI system. These objectives will provide a reason to care about each boundary in that architecture.