Recommended resources
The freely available resources this lesson will direct you to.
- Introduction to TOGAF ADM: Phase B, C, D Business, Information Systems and Technology Architectureswww.youtube.com
- TOGAF in 12 Minutes: No jargon. Just what you need to know.www.youtube.com
- TOGAF Artifacts | QualiWare Center of Excellencecoe.qualiware.com
- Framework Guidance and TOGAF™ 9 Examplepubs.opengroup.org
Hello. In the previous lesson, you saw how the TOGAF Content Metamodel helps keep descriptions of processes, applications, data, and other architectural elements consistent. Those descriptions still need to be presented in a form people can use. An application inventory, a cross-reference of applications and data, and a picture of application connections might all describe parts of the same architecture, but they answer different questions.
This lesson focuses on the three forms TOGAF uses to classify architecture artifacts: catalogs, matrices, and diagrams. You will learn to recognize each form by what it communicates, not just by its name. That is the useful distinction for both architecture work and Foundation-level questions.
Three ways to present architecture content
Recall the distinction between a deliverable, an artifact, and a building block. A deliverable is a work product provided for review or use. An artifact is a representation of the architecture that may be included in a deliverable. A building block is an architectural element that an artifact describes. A drawing of an application is not the application itself.
The image below places the three artifact forms in that larger picture. Its repository side also hints at a later topic: architecture content can be retained for reuse.
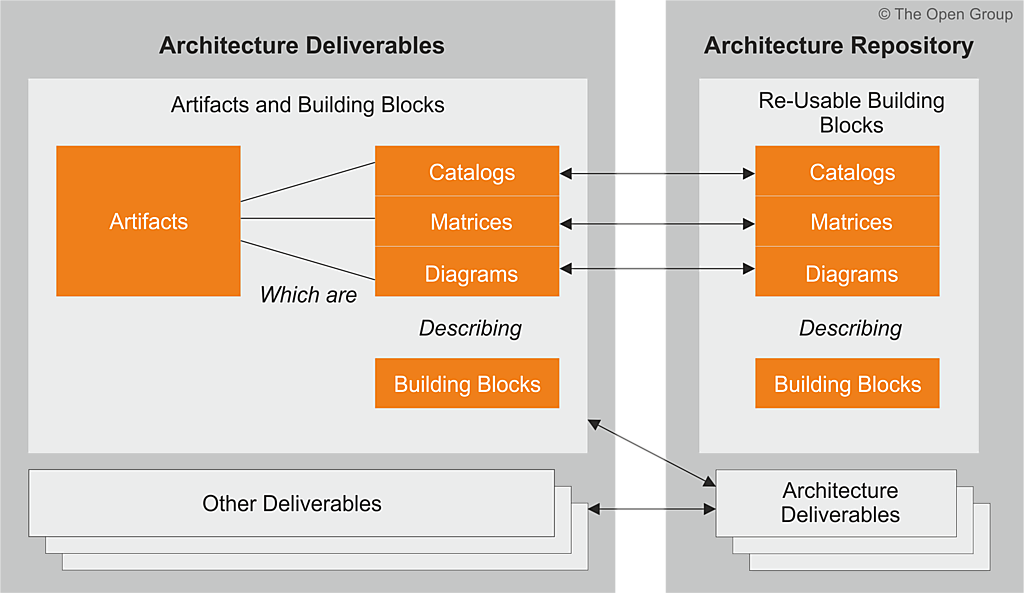
The most useful first distinction is:
| Artifact form | Primary question it answers | Typical presentation |
|---|---|---|
| Catalog | What items are in scope, and what do we know about each one? | A structured list or inventory |
| Matrix | Which items of one type relate to which items of another type? | A cross-reference with items on two axes |
| Diagram | How are selected elements arranged or connected? | A graphical representation |
Read the short definitions and three examples in the following resource. It reproduces material associated with an earlier TOGAF edition, so use it to understand the enduring forms and illustrative examples—not to memorize its artifact counts as a definitive list for the TOGAF Standard, 10th Edition.
TOGAF Artifacts | QualiWare Center of Excellence
Read “TOGAF Artifacts” from the QualiWare Center of Excellence to see the three artifact classes defined, then examine one example of each. Focus on what each example is designed to reveal.
Near the top, find the sentence beginning “TOGAF defines three distinct artifact classes”. Read the three definitions, ending with the explanation of how diagrams support stakeholder communication. Stop before the long list headed “Catalogs (14 types)”. Then go to “TOGAF artifacts described” and find these three named entries; you do not need to read the intervening entries. Under “Application/Data Matrix”, read the matrix description, from its purpose through the sentence identifying its two axes. Under “Application Portfolio Catalog”, read the catalog description, from the inventory’s purpose through its use as a starting point. Under “Application Communication Diagram”, read the diagram description, from its purpose through the guidance on what to show. Notice that the matrix and diagram can both involve applications, yet emphasize different relationships.
The definitions are short, but an important subtlety follows from them: the subject matter does not determine the artifact class. Applications can appear in a catalog, a matrix, or a diagram. What changes is the question the representation makes easiest to answer.
One architecture, three artifacts
Imagine an organization improving how customers check an order’s status. Its architecture description includes a Customer Portal, an Order Service, a Notification Service, an Order Record, and Contact Details. These names represent elements being described; they are not themselves artifacts.
First, the architecture team needs an agreed inventory of applications. An Application Portfolio Catalog could contain entries such as:
| Application component | Main purpose | Lifecycle status |
|---|---|---|
| Customer Portal | Lets customers check orders | In use |
| Order Service | Manages order information | In use |
| Notification Service | Sends customer messages | Proposed |
This is a catalog because it records the items and useful facts about each item. Its columns do not turn it into a matrix: each row still describes one application. A catalog might have many columns—name, owner, status, description—while remaining an inventory.
Next, the team needs to know which applications use which data. An Application/Data Matrix might show:
| Application component | Order Record | Contact Details |
|---|---|---|
| Customer Portal | Reads | Reads |
| Order Service | Updates | — |
| Notification Service | — | Reads |
This is a matrix because its two axes name different sets of architectural elements: applications in the rows and data entities in the columns. The cells record their relationships. The dashes mean only that no relationship is recorded in this view; they are not proof that an application could never use that data. Compared with the catalog, the matrix makes a cross-cutting question much easier to answer: Which applications are affected if access to Contact Details changes?
Finally, an Application Communication Diagram could place the three applications as graphical elements and show the interfaces through which they communicate. It might include the Customer Portal’s connection to the Order Service and a connection used to request notifications. Rather than supplying a master inventory or systematically crossing applications with data entities, the diagram helps a stakeholder see the pattern of connections.
Here is a brief visual example of application architecture diagrams. You do not need to learn the diagramming notation yet; watch for how the position of components and their connections convey an architecture at a glance.
Introduction to TOGAF ADM: Phase B, C, D Business, Information Systems and Technology Architectures
Watch this excerpt from VisualParadigm’s “Introduction to TOGAF ADM: Phase B, C, D Business, Information Systems and Technology Architectures” for an example of a graphical application landscape.
Watch application landscapes. The presenter moves from existing applications and their connections to a proposed future arrangement. Focus on what the picture communicates about components and their relationships, rather than on the particular applications in the example.
A diagram can show relationships, just as a matrix can. The distinction is not “matrices have relationships, diagrams do not.” A matrix lays out a systematic cross-reference, making it useful for checking coverage across two sets of items. A diagram uses graphical placement and connections to communicate a selected structure or pattern. Which one is more useful depends on the concern being addressed.
Classifying unfamiliar artifacts reliably
The names in the reading are helpful clues: “Application Portfolio Catalog”, “Application/Data Matrix”, and “Application Communication Diagram” announce their classes. But names alone are a fragile classification method. A team may use an unfamiliar title, or a document may contain several artifact forms. Look instead at the organizing structure:
- If the principal structure is one entry per item, with facts about that item, classify it as a catalog. A list of applications with owners and lifecycle states remains a catalog even when displayed as a table.
- If the principal structure crosses two sets of items and records their associations in cells, classify it as a matrix. An Actor/Role Matrix, for example, can show which actors perform which roles.
- If the principal structure depicts elements and their connections graphically, classify it as a diagram. A Process Flow Diagram, for example, shows activities and how control passes between them.
The distinction is about the artifact’s primary purpose, not whether it contains a particular word or uses a particular software tool. A diagram may have an accompanying legend or table. A catalog may record an interface as an entry and describe what it connects. Those additions do not necessarily change the artifact’s main form.
Keep the earlier deliverable distinction in view as well. An Architecture Definition Document may contain a catalog, a matrix, and a diagram. It is the deliverable that brings those artifacts together, not a fourth artifact class. Likewise, the applications and data described in the examples are architectural subjects, not artifacts merely because they have been listed or drawn.
For Foundation study, the durable rule is therefore concise: catalogs inventory; matrices cross-reference; diagrams visualize. For practical architecture work, add one more question: What does the stakeholder need to find out? The answer often tells you which representation will be clearest.
Key takeaways
Catalogs, matrices, and diagrams are three forms of architecture artifact. A catalog gives a structured inventory of items; a matrix makes relationships across sets of items explicit; a diagram graphically communicates selected elements and connections. The same architectural element can appear in all three without becoming three different elements.
In the next lesson, you will examine the Architecture Repository more closely: where architecture outputs and reusable assets are held, and what its major components are for.