Recommended resources
The freely available resources this lesson will direct you to.
- Top 5 Statistics Concepts in Data Science Interviews: P-value, Confidence Interval, Power, Errorswww.youtube.com
- A/B Testing in Data Science Interviews by a Google Data Scientist | DataInterviewwww.youtube.com
- Confidence interval computation for evaluation in machine ...github.com
- Creating Confidence Intervals for Machine Learning ...sebastianraschka.com
Hello. In the previous lesson, you moved from point estimation to the distinction between MLE and MAP: an estimate such as a model’s measured accuracy is a quantity computed from finite data, not the final truth about future performance. This lesson adds the missing piece: how uncertain is that estimate?
For ML engineering interviews, this matters whenever you report offline evaluation, compare model versions, or decide whether a performance change is credible. By the end, you should be able to construct a confidence interval for accuracy, choose an appropriate method for a general ML metric, and explain precisely what the interval does—and does not—mean.
From a test metric to an uncertain estimate
Suppose a pedestrian detector is evaluated on independent, representative test examples and makes correct predictions. Its observed accuracy is:
The notation signals an estimate. The quantity we actually care about is the model’s true expected accuracy on the deployment population, call it . That value is fixed but unknown. A different representative test sample would likely yield a slightly different .
A confidence interval provides a range of plausible values for that unknown performance parameter under a stated sampling procedure and statistical assumptions.
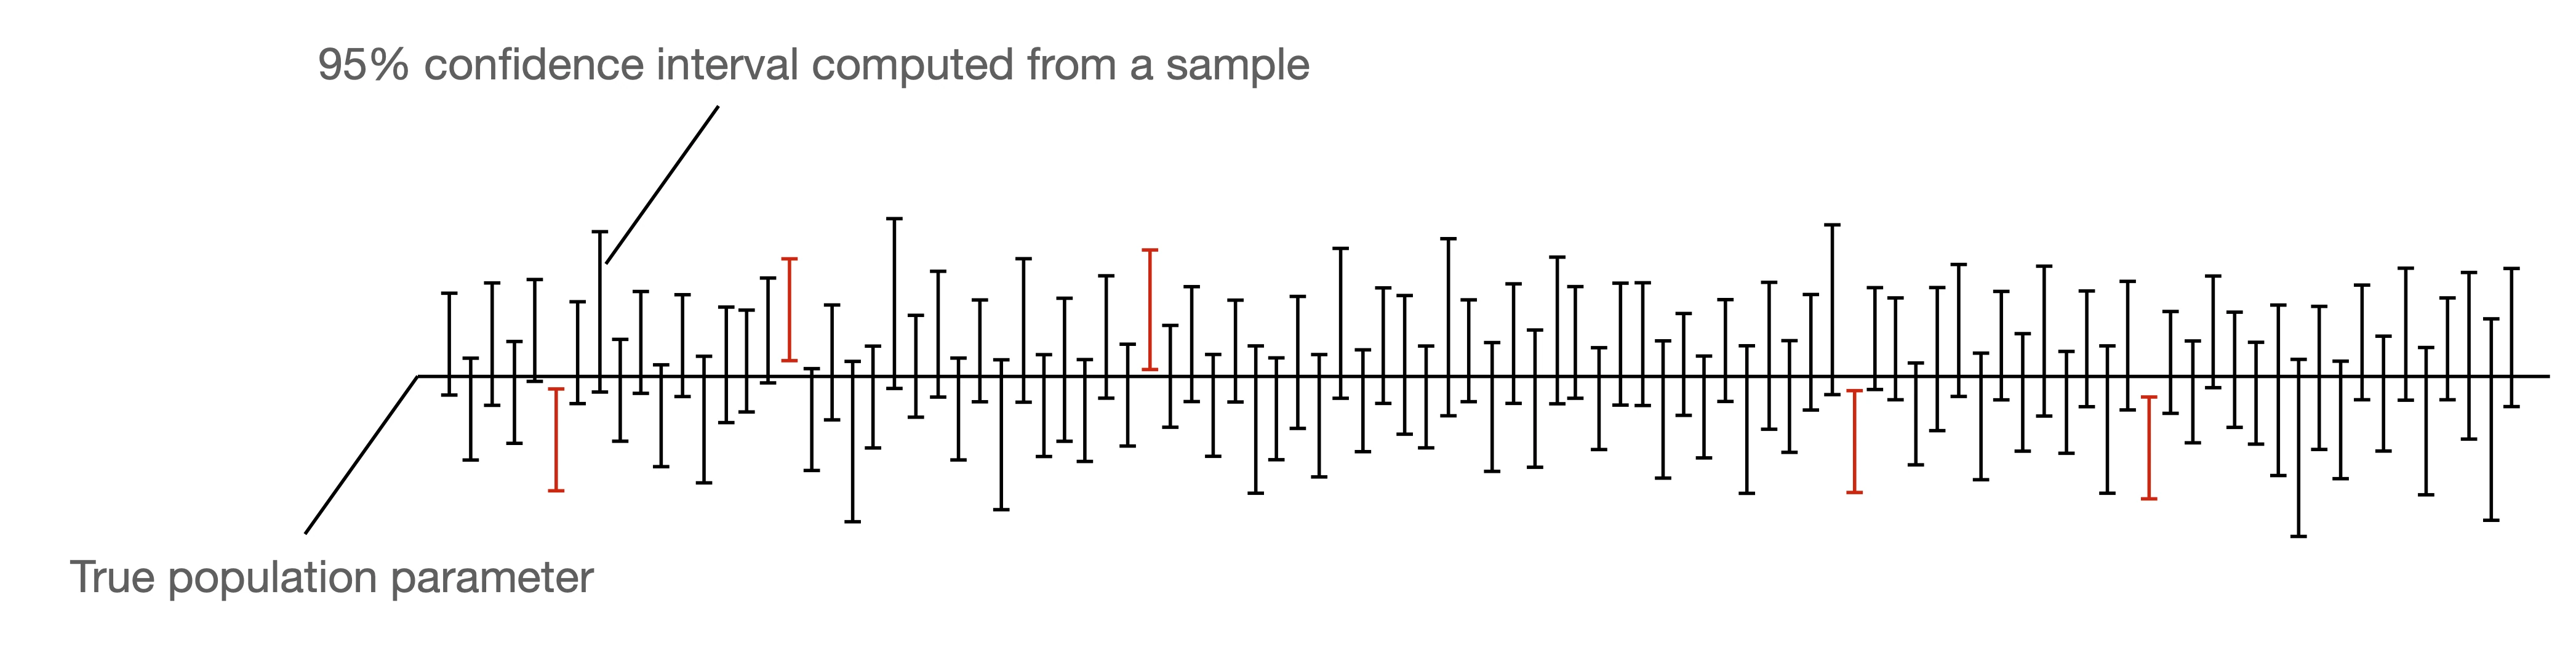
A 95% confidence interval is best interpreted as a property of the method, not as a probability assigned to the already-fixed parameter:
If we repeatedly sampled comparable test sets and constructed intervals using the same valid procedure, about 95% of those intervals would contain the true deployment-population metric.
It does not mean “there is a 95% chance that the true accuracy is inside this particular interval.” Once the interval has been computed, it either contains the fixed true value or it does not. What was random was the test sample and therefore the interval endpoints.
Top 5 Statistics Concepts in Data Science Interviews: P-value, Confidence Interval, Power, Errors
Watch “Top 5 Statistics Concepts in Data Science Interviews” by Emma Ding for a compact interview-oriented explanation of the frequentist interpretation of a confidence interval.
Watch CI interpretation. Focus on the reversal of the common misconception: the true parameter is fixed, while the interval changes when the sample changes. Also note why higher confidence and smaller samples produce wider intervals.
Two immediate consequences follow:
- More test data generally produces a narrower interval because the evaluation estimate is more precise.
- Higher confidence, such as 99% instead of 95%, produces a wider interval because the procedure must cover the true value more often in repeated use.
- A narrow interval is only useful if the test set represents the population about which you want to make a claim. Precision cannot repair a biased or unrepresentative test set.
For an automotive perception model, “representative” is substantive: it may require the intended mix of night driving, rain, rare vulnerable-road-user cases, road types, sensor configurations, and geographic regions. An interval around a convenient test set is not automatically an interval for real-world safety performance.
Constructing a normal-approximation interval for accuracy
For accuracy, each evaluation result can be represented as a Bernoulli variable:
The test accuracy is the sample mean:
If individual evaluation units are independent and identically distributed, and the sample is sufficiently large and not too close to 0 or 1, the estimated standard error of accuracy is:
For a two-sided 95% interval, the normal critical value is approximately . The interval is:
Worked example
Return to the detector with on independent test examples.
The 95% margin of error is:
Thus the normal-approximation interval is:
A careful report would read:
Accuracy: 89.2%
95% confidence interval: 87.3% to 91.1%
Evaluation population: independently sampled pedestrian-detection examples from the defined validation distribution.
The interval concerns the model’s generalization accuracy for the stated population, conditional on the trained model being evaluated. It does not establish that the system is safe, that the error rate is uniform across conditions, or that performance will remain stable under future distribution shift.
Creating Confidence Intervals for Machine Learning ...
Read Sebastian Raschka’s concise guide to connect the statistical definition of a confidence interval directly to ML test-set accuracy.
Start in “Confidence Intervals in a Nutshell.” Read the ML interpretation, distinguishing test accuracy from the unknown generalization accuracy. Then read “Method 1: Normal Approximation Interval Based on a Test Set.” Focus on the accuracy interval calculation: identify the point estimate, test-set size, standard error, and normal critical value. The displayed implementation is optional; the formula and its assumptions are the important parts.
When this calculation is suitable—and when it is not
The normal approximation is fast and useful for a large test set and an accuracy value away from the boundaries. But it can produce invalid bounds below 0 or above 1 when the test set is small or accuracy is near 0% or 100%.
For binary accuracy in such cases, a bounded binomial interval such as a Wilson interval is often preferable. In practical ML work, however, there is an even more broadly applicable choice: bootstrap the test set predictions. It works not only for accuracy, but also for metrics such as F1, AUROC, mean average precision, and calibration error, whose uncertainty is not as conveniently summarized by the binomial formula.
Bootstrap intervals: resample the evaluation set, not the model
A test-set bootstrap treats the held-out evaluation sample as an approximation to the population. It repeatedly resamples evaluation examples with replacement, computes the metric on every resample, and uses the resulting empirical distribution to quantify uncertainty.
For a fixed trained model, the procedure is:
- Run inference once on the full untouched test set and retain each example’s label, prediction, score, and relevant group identifiers.
- Create a bootstrap sample by drawing test-example indices with replacement.
- Compute the metric on those resampled prediction-label pairs.
- Repeat many times, commonly thousands of bootstrap replicates.
- For a 95% percentile interval, take the 2.5th and 97.5th percentiles of the bootstrap metric values.
If the 2.5th percentile of bootstrapped mAP values is 0.401 and the 97.5th percentile is 0.438, report:
\operatorname{mAP} = 0.420 \quad \text{with 95% bootstrap CI} \quad [0.401,\;0.438]The central estimate should normally be the metric computed on the original test set, not a replacement for it. The bootstrap distribution tells you how that estimate would vary under repeated sampling from a comparable evaluation population.
The operational advantage is important in deep learning: you do not retrain the model for every bootstrap replicate. Resampling stored test predictions makes the computation inexpensive once inference has completed.
Confidence interval computation for evaluation in machine ...
Read the repository guide’s practical treatment of bootstrap confidence intervals for system evaluation, including the key adjustment for correlated observations.
In “The bootstrap approach for computing confidence intervals for system evaluation,” read the bootstrap procedure. Track why resampling is done with replacement and why the final bounds are percentiles of the metric distribution. Then read the paired comparison discussion in “Evaluation of systems.” Finally, read the dependence warning immediately before “Evaluation of methods.” This last part is particularly relevant when many frames originate from the same drive.
The independence trap: frames are not independent evidence
The formula for an accuracy interval and the simplest bootstrap both assume that evaluation units are independent. Consecutive frames from one drive share scene geometry, weather, lighting, route, sensor state, and temporal context. Treating 10,000 frames from a small number of trips as 10,000 independent observations commonly makes intervals much too narrow.
The remedy is to resample at the meaningful independent unit:
| Evaluation setting | Resample unit |
|---|---|
| Independent user requests | Request, after checking session dependence |
| Medical images with repeated exams | Patient |
| Object detection on driving videos | Trip, scene, or carefully defined clip |
| A/B test with repeated user activity | User, rather than individual events |
| Multiple sites or fleets | Site, vehicle, or route cluster where appropriate |
This is often called a cluster or group bootstrap. Draw groups with replacement, then include all their associated examples. It typically widens the interval, not because the model changed, but because the original individual-frame analysis overstated the amount of independent evidence.
A good interview answer states the assumption explicitly:
“I would bootstrap at the unit that is plausibly independent in deployment. For driving video, I would not resample frames independently if they come from the same trip; I would resample trips or scenario clusters. Otherwise, correlated failures can create falsely narrow confidence intervals.”
What uncertainty are you measuring?
“95% CI” is incomplete unless you explain the source of randomness. ML results contain several distinct sources:
| Interval target | What varies? | What it answers |
|---|---|---|
| Fixed-model test-set CI | Test examples | How uncertain is this trained model’s metric on the target population? |
| Seed-based CI | Training initialization, minibatch ordering, sometimes data augmentation | How stable is the training procedure across stochastic runs? |
| Retraining/data-resampling CI | Training data and fitted model | How much would performance change if the full training pipeline were repeated? |
| Online experiment CI | Randomized users or units | What is the uncertainty in causal lift of a product or model change? |
Do not mix these interpretations.
If a model was trained once and evaluated on 50,000 held-out examples, bootstrapping the test predictions estimates test-sampling uncertainty conditional on that exact trained model. It does not reveal whether a different random seed would have produced a weaker model.
Conversely, evaluating several seed-trained models on one fixed test set estimates training instability, but it does not by itself capture uncertainty from sampling a new test population. Both may matter for a research benchmark or high-stakes model release; the key is to name what the interval represents.
Comparing two model versions: use an interval for the difference
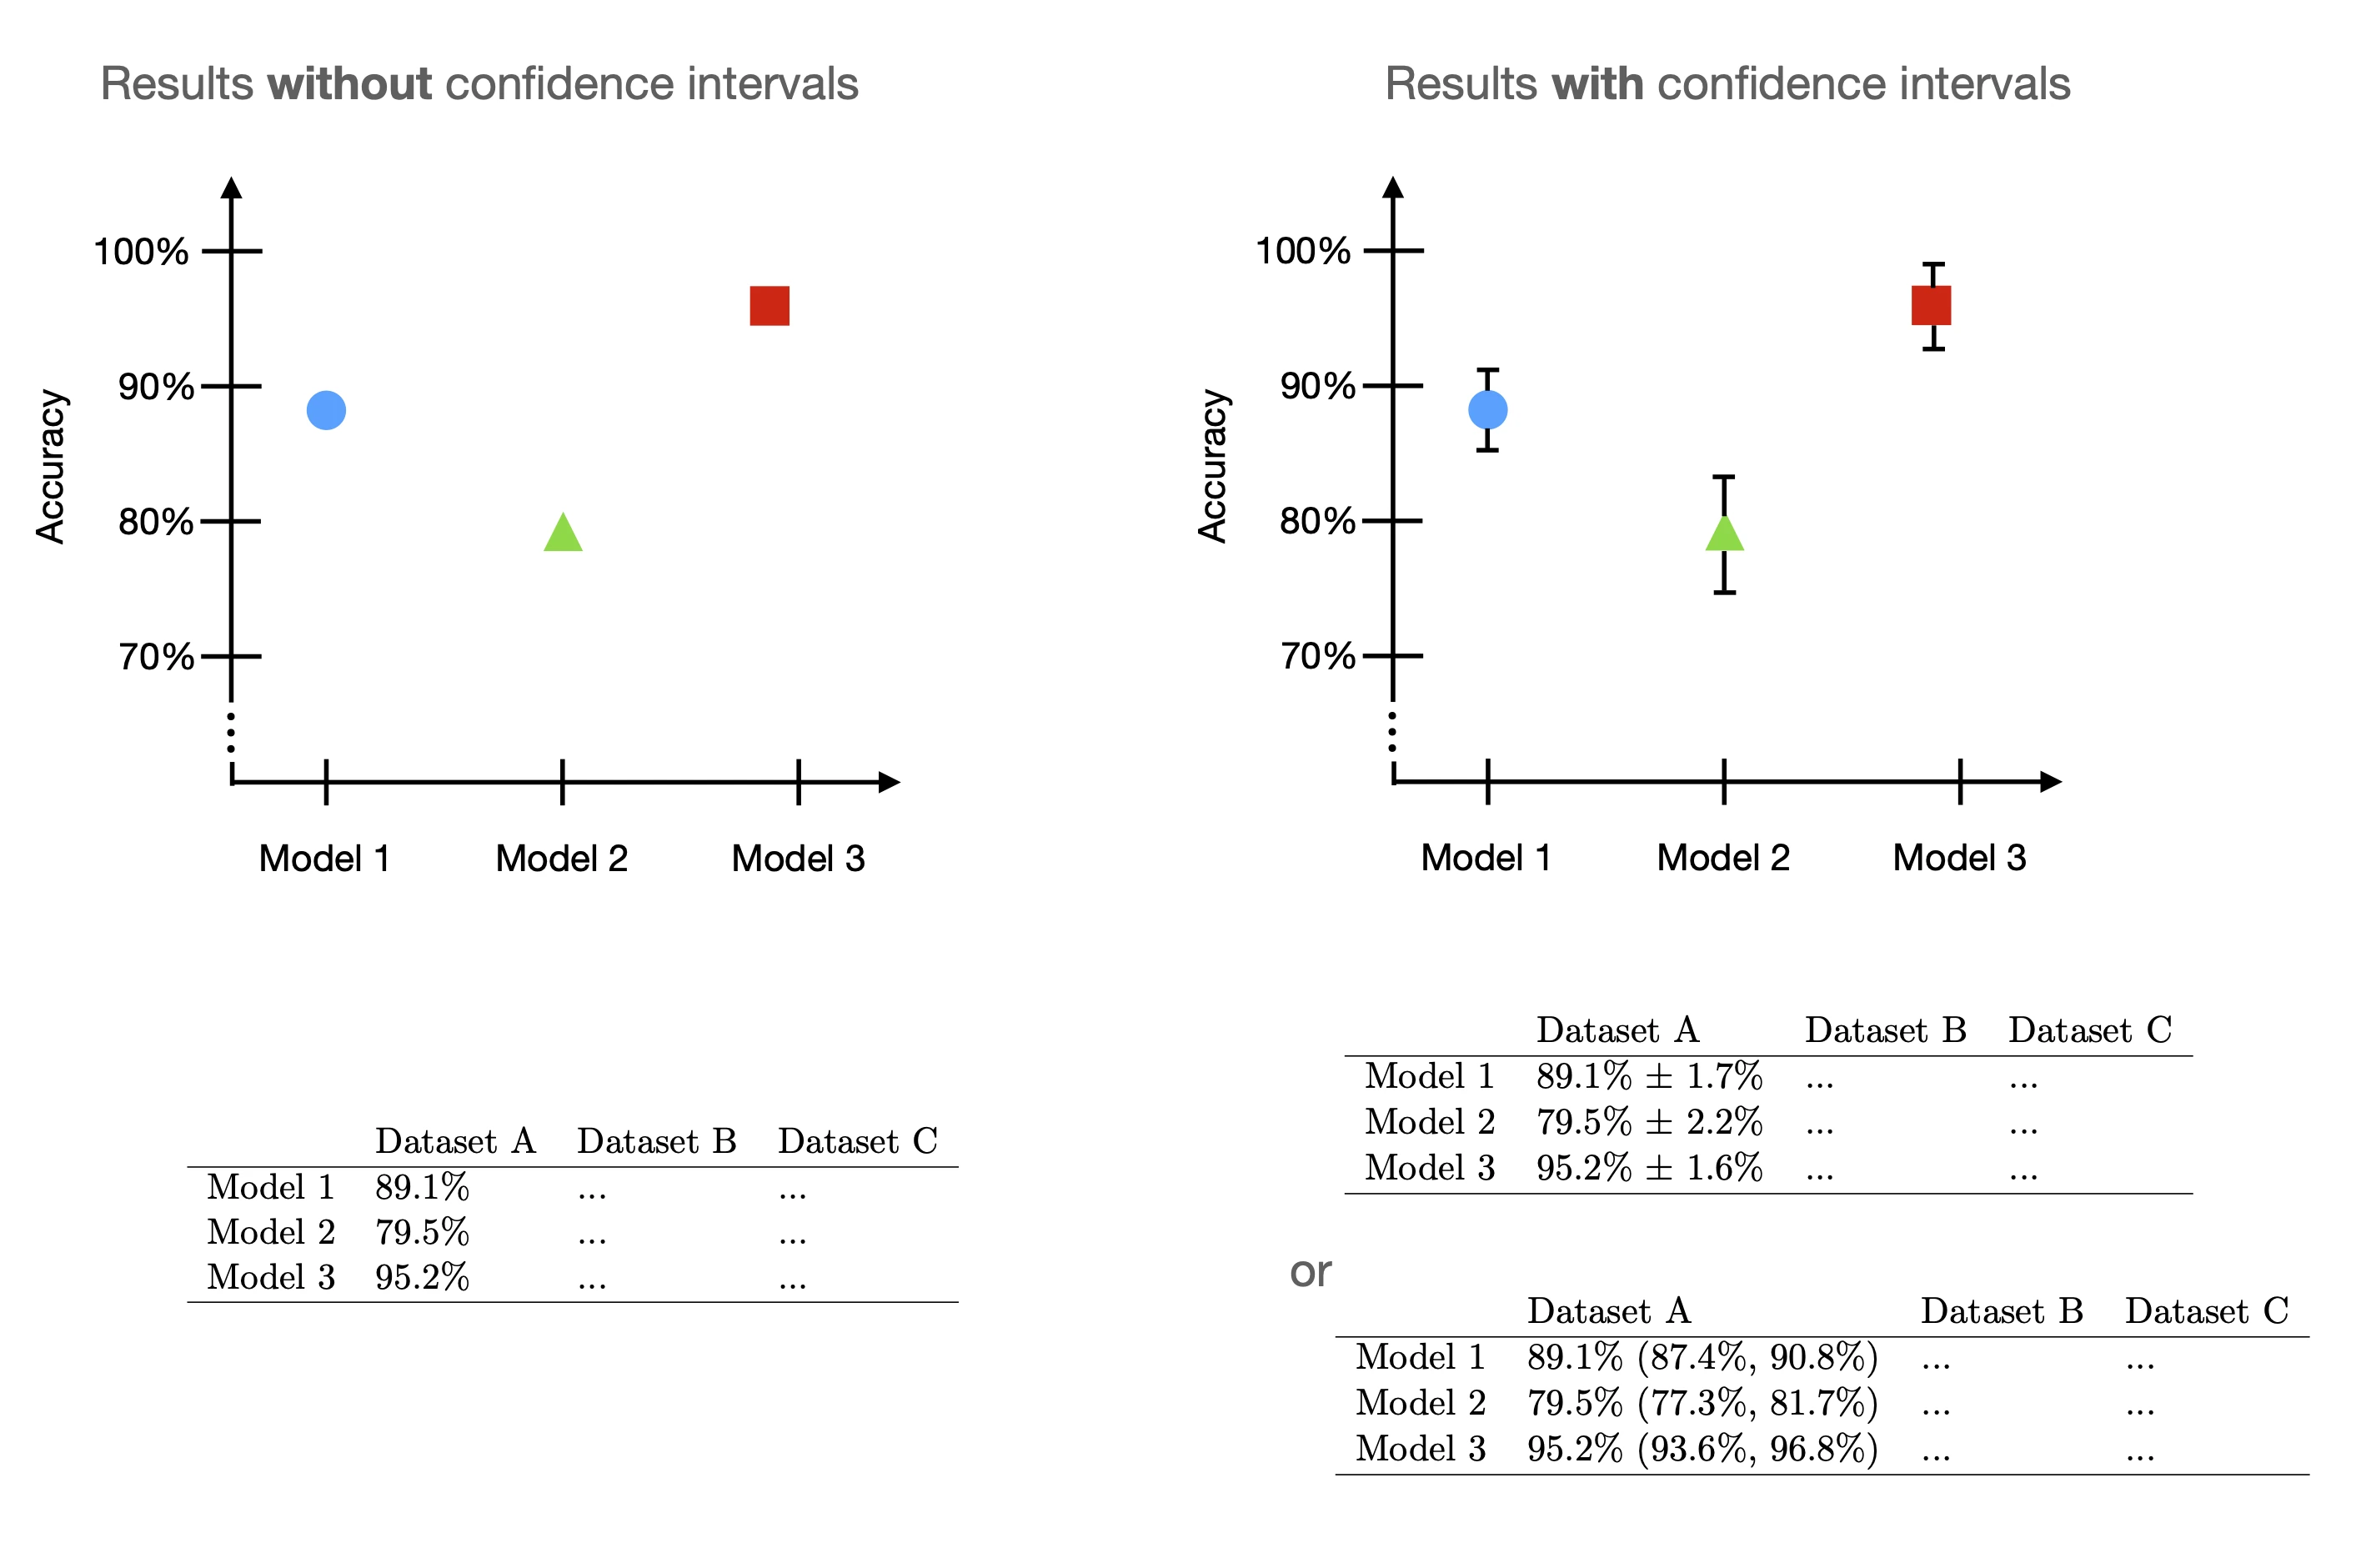
A common mistake is to compare two separate model intervals by eye:
- Model A accuracy: 89.2% with a 95% CI of 87.3% to 91.1%
- Model B accuracy: 90.1% with a 95% CI of 88.2% to 92.0%
Overlapping individual intervals do not prove that models are tied. Non-overlap can be useful evidence of a difference, but overlap is not a valid test for “no difference.”
Instead, evaluate both models on the same held-out examples and construct an interval for the paired difference:
For every bootstrap replicate, resample the same indices for both models, compute both metrics, and record:
Then take the 2.5th and 97.5th percentiles of the values.
Suppose the result is:
\Delta_{\text{mAP}} = 0.012 \quad \text{with 95% CI} \quad [0.003,\;0.021]Because zero is outside the interval, the result is consistent with Model A having higher mAP than Model B at the conventional 5% significance level. The pairing matters: difficult and easy examples affect both models, and paired resampling preserves that shared structure.
However, statistical significance is not a launch decision. A 0.3-point mAP improvement may be statistically detectable at massive scale but operationally irrelevant. Before looking at the outcome, define a practical threshold, perhaps a minimum improvement in vulnerable-road-user recall or a maximum allowable regression in nighttime false positives.
A/B Testing in Data Science Interviews by a Google Data Scientist | DataInterview
Watch the decision-focused segment from “A/B Testing in Data Science Interviews” by DataInterview. It connects confidence intervals to practical, not merely statistical, significance.
Watch decision scenarios. Focus on the distinction between an interval entirely above zero and an interval entirely above a predefined practical-effect threshold. Translate the revenue examples into an ML release criterion such as a minimum acceptable recall lift.
A strong release statement might be:
“The candidate improves pedestrian recall by 1.4 percentage points, with a paired 95% bootstrap interval of 0.3 to 2.5 points. The interval excludes zero, so the evidence supports a positive change. But our pre-specified practical threshold is 1 point. Since the lower bound is below that threshold, I would not claim that a practically meaningful improvement is established. I would inspect safety slices and consider gathering more independent route-level evaluation data.”
The next lesson will formalize this comparison logic through hypothesis testing. For now, remember the core construction: compare the distribution of paired differences, not the overlap of two separately reported intervals.
Interview-ready method selection
When asked, “How would you report uncertainty for this model metric?”, reason in this order:
-
Define the estimand.
Is it generalization accuracy of a fixed model, expected mAP, seed-to-seed training stability, or online causal lift? -
Define the evaluation population and independent unit.
State the target distribution and check whether examples are actually independent. Use trips, users, or other clusters when required. -
Choose a method that matches the metric.
- Large-sample accuracy or error rate: normal approximation can be sufficient.
- Bounded metrics near an extreme or small sample sizes: use a more appropriate binomial interval or bootstrap.
- Complex metric such as F1, mAP, AUROC, or a slice metric: bootstrap stored test predictions.
- Deep-learning training stability: evaluate repeated seeds and use an interval across runs.
-
Report the point estimate, interval, confidence level, test size, and population.
A bare value such as “mAP is 0.42” is incomplete. -
For a comparison, bootstrap the paired difference and assess practical relevance.
Do not rely on overlap of individual error bars.
Key takeaways
A confidence interval quantifies uncertainty in an estimate caused by finite sampling. For a 95% frequentist interval, the correct interpretation is long-run coverage: across repeated comparable samples, 95% of intervals constructed by a valid method contain the fixed true parameter.
For accuracy on a sufficiently large independent test set:
For metrics without a convenient closed-form uncertainty calculation, bootstrap the held-out prediction-label pairs and use percentile bounds. Preserve the actual independent unit: for correlated driving frames, resample trips or scenario clusters rather than individual frames.
Finally, distinguish uncertainty in a fixed model’s test performance from seed-to-seed training variation and from online experimental lift. When comparing two models on the same test set, construct a paired confidence interval for the metric difference, then interpret it alongside a pre-defined practical threshold.
Next, you will build on this by selecting and interpreting statistical hypothesis tests for comparing model variants.