Recommended resources
The freely available resources this lesson will direct you to.
Welcome back. Last time, you worked backward from a downstream decision to define when ingested data is usable—and what evidence would support claims about its freshness, completeness, accuracy, and traceability. Those requirements now give you a way to assess the current ingestion experience. A file can arrive and still leave a reviewer waiting; a failed validation can be technically correct and still leave an implementer unable to recover.
In this lesson, you’ll diagnose where that friction occurs and what it costs the customer. The discipline is to reconstruct a real journey from customer accounts and observable records before treating a requested feature as the problem.
Follow one actual journey
An ingestion journey is rarely a single user clicking “upload.” A data owner prepares an export, an implementer or administrator configures its delivery, and an end user waits for trustworthy data. A risk reviewer may need to understand an exception before the data can be used. Friction can arise within a step, but also between people: one person sees a failure and another holds the information needed to resolve it.
Begin with a recent, specific instance: “Tell me about the most recent time you sent a final trial balance and it did not become usable as expected.” Then follow the account in order. What triggered the export? What did the person do next? What did they see? Who became involved, and what happened before the reviewer could proceed? This is more informative than asking whether customers “like onboarding” or whether they would use a proposed dashboard.
Build better products with continuous product discovery | Teresa Torres
Watch “Build better products with continuous product discovery,” featuring Teresa Torres on Lenny’s Podcast, for why concrete customer stories reveal opportunities that general opinions miss.
Watch customer stories. Torres contrasts abstract questions with asking about a recent event, then explains why an opportunity must name a precise difficulty rather than a vague wish for easier use. As you watch, consider what details an implementer might leave out if asked only, “What’s difficult about ingestion?”
For an ingestion interview, useful follow-ups include “What was the last status you saw before you asked for help?”, “How did you decide whether the file was safe to use?”, and “What did the reviewer do while waiting?” Ask to see the relevant status history, ticket, or a redacted example if the customer can share one. Avoid requesting sensitive financial records merely to establish that a step was confusing; field names, timestamps, counts, and appropriately redacted messages may suffice.
Treat a feature request as a clue. “We need an automatic mapper” tells you what the speaker thinks might help. It does not yet tell you whether the underlying difficulty is an unexpected source format, an incorrect configuration, an unclear error, or a handoff between teams. Ask about the last occasion that prompted the request, including any workaround they used. Their actions and consequences are the evidence you need to diagnose the friction.
Map what is known—and mark what is assumed
A current-state journey map is a working account of what people do today, not a polished picture of how you wish the product worked. Lay out the major moments from source preparation to first usable data. For each moment, note the actor, their action, the evidence they encounter, and any delay, rework, uncertainty, or handoff. Leave gaps visible.
Nielsen Norman Group describes this approach in the current-state portion of its journey-mapping workshop guide. Its workshop format is optional; the important practice is to make the team’s assumptions visible and let customer accounts change the map.
How to Run a Journey-Mapping Workshop: A Step-by- ...
Read Nielsen Norman Group’s guide for a method of moving from an assumption map to customer-supported pain points.
Under “Part II: Current-State Mapping,” read Step 1, “Map the current state,” from the draft map. Continue through Step 2, “Interview customers,” from customer interviews, and Step 3, “Evolve the map,” from map revision. Then read Step 4, “Generate and prioritize pain points,” from pain points. Focus on the order: draft what the team thinks it knows, hear the customer’s account, revise the map, and only then discuss which frustrations matter most.
Consider a hypothetical close-day journey. The customer’s approved trial balance is available at 17:20. An implementer uploads it at 18:05. At 18:09, the product displays “Validation failed,” without identifying a field or row. The implementer opens a support ticket at 18:14; the first useful reply arrives at 08:20 the next business day. The report becomes usable at 09:12, after the reviewer’s 09:00 decision deadline.
That sequence points to possible friction, but the times alone do not explain it. An evidence map might look like this:
| Moment | Evidence to seek | What remains uncertain |
|---|---|---|
| Export prepared and sent | Data owner’s account; approval, export, and upload times | Was this the intended final export and configuration? |
| Validation failed | Product event and error shown to the implementer | Which check failed? Could the implementer have identified or corrected it? |
| Help requested | Ticket, handoff times, and implementer’s account | Was support needed for technical access, interpretation, or approval? |
| Report reviewed | Reviewer’s account and product-ready time | What decision was delayed, and was another source used meanwhile? |
The table deliberately separates an observation (“the displayed message was ‘Validation failed’”) from an inference (“the message caused the long delay”). To test that inference, find out what the implementer tried after seeing it. Perhaps the ticket shows they inspected several columns without knowing which check had failed. Perhaps a support reply identified a missing required field. That would strengthen the case that diagnosis, not merely processing time, created effort. It would still leave open why the field was missing.
This also preserves the boundary from the previous lesson. The export was approved by 17:20, but the upload happened at 18:05; product processing, customer delivery, support, and report readiness each have their own clock. Do not label the entire interval a platform processing delay. Equally, do not call the journey successful because the upload was accepted if the reviewer could not use the report by 09:00.
Find the friction beneath the request
The most useful diagnosis locates the point at which a person’s progress was interrupted and describes the consequence. It does not have to establish a technical root cause prematurely.
A Product Talk account of a customer moving to a new API illustrates why. A broad complaint that the API was difficult concealed several distinct difficulties, including workflow variation and documentation that no longer matched the API. The example is outside fintech, but the discovery problem is familiar: a proposed fix for “the API” would be too broad to address each source of delay.
Product in Practice: Transitioning Customers to a New API
Read Product Talk’s first customer story for an example of turning a broad complaint into specific difficulties encountered during implementation.
In “Story #1: Moving from SOAP to REST, Handling Workflow Variations, and Dealing with Incorrect Documentation,” start at the workflow account. Stop before the paragraph beginning “The bottom line.” Notice the difference between the customer’s overall judgment of the API and the particular work developers had to redo, investigate, or escalate.
Return to the hypothetical trial balance. “Build automatic mapping” is a solution idea. “The implementer cannot identify which required field failed validation, so they must seek support before resubmitting the close-day export” is a candidate diagnosis of friction. It names the actor, the interrupted task, the observed obstacle, and the consequence. It does not assume that automatic mapping—or any other feature—is the right response.
You can narrow the diagnosis further without overstating certainty. Suppose a redacted validation record indicates that account_code was missing, while the submitted file contains a column headed Account Code. You now have evidence of a mismatch for this attempt. You do not yet know whether the customer chose a different export profile, the documented format was unclear, a saved mapping was wrong, or the product handled the header incorrectly. Speak with the data owner and implementer, and compare the agreed input format with what was submitted, before assigning cause or responsibility.
The Opportunity Solution Tree pictured below makes the distinction visible. Its opportunity layer represents customer needs and pain points; solutions and assumption tests sit beneath it. The image is a framework for organizing a diagnosis, not evidence that any particular ingestion problem exists.
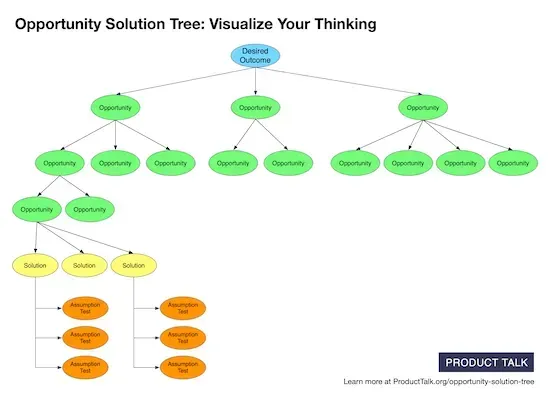
Build better products with continuous product discovery | Teresa Torres
Return to Teresa Torres’s discussion of the opportunity layer in “Build better products with continuous product discovery.” This segment sharpens the distinction between diagnosing a need and naming a feature.
Watch opportunities first. Focus on her definition of an opportunity as an unmet need, pain point, or desire, and on her warning that teams often place solutions where customer problems belong.
There is a practical test for your wording: Could the same friction conceivably be reduced in more than one way? If so, you have probably left room to investigate. “The implementer cannot tell what to correct after a failed validation” leaves several responses open. “The implementer needs an AI mapping assistant” has already chosen one.
Judge the strength and significance of the diagnosis
A vivid interview is useful, but one account does not establish how widespread a problem is. Conversely, a high ticket count may reveal volume without showing what customers were trying to accomplish or whether the issue blocked a consequential decision. Combine sources for different purposes:
- Customer accounts and observed work reveal actions, workarounds, handoffs, and effects on the downstream user.
- Product events and validation records establish what the product received, displayed, rejected, and made usable, with timestamps.
- Tickets and support notes show escalation paths and effort, though they omit customers who worked around a problem without contacting support.
- Data-owner or administrator evidence can clarify the source export, permissions, configuration, and who was able to change them.
Corroboration means checking whether these accounts describe the same attempt, not simply collecting more artifacts. Match the relevant export or job identifier, entity, period, and time zone where available. If records disagree, retain the disagreement: a customer may remember receiving an error at 18:09 while the event log records 18:11. Investigate whether those times represent different events before drawing a conclusion.
When deciding which friction warrants further attention, examine its impact on the intended decision. How much time or manual work did it add? Did it prevent the data from reaching a usable state, or only make a recoverable step annoying? Did it recur for customers with the same source and ingestion method? How many journeys were eligible to encounter it—not just how many generated tickets? A dot vote in a workshop can identify what participants believe is important; it cannot, by itself, establish prevalence or customer impact.
For the hypothetical case, a defensible finding at this stage might be:
In the observed close-day attempt, the implementer received a nonspecific validation failure and sought support before the report became usable. The 09:00 review deadline was missed. Records and interviews are still needed to determine what caused the validation failure, how much of the delay was attributable to diagnosis, and whether similar attempts encounter the same obstacle.
This is more useful than either “ingestion is broken” or “we need automatic mapping.” It distinguishes what happened, why it mattered, and what is still a hypothesis. If other attempts show different failures, keep them separate rather than forcing them into one convenient explanation.
Key takeaways
Diagnose ingestion friction by reconstructing a recent journey across the people who prepare, deliver, troubleshoot, and use the data. Mark assumptions on the current-state map; check customer accounts against product events and support records; and locate the interrupted task and its effect on a downstream decision. Keep observed symptoms, suspected causes, and proposed solutions distinct.
Next, you’ll turn a high-value, evidence-backed opportunity into a testable problem statement. The strongest input to that statement is not a preferred feature—it is a precise account of who struggles, at which moment, with what consequence, and what evidence supports the claim.