Recommended resources
The freely available resources this lesson will direct you to.
Hello! Last time, you designed a dimension row with a warehouse surrogate key, a retained source key, and descriptive attributes at a declared grain. You also placed country, region, and city on the same row—but only after assuming that each listing belonged to one city, each city to one region, and each region to one country.
This lesson tests that assumption. You’ll model balanced, ragged, and parent-child hierarchies, then decide when a flattened dimension remains the clearest design and when another structure is justified. The emphasis is on rollups that return the right answer, not merely a diagram that looks tidy. Estimated study time: about 40 minutes.
A hierarchy is a rule for grouping facts
A dimension hierarchy defines which lower-level members belong to which higher-level members. If a property-sale fact refers to one listing, and that listing has one agreed reporting region, summing sale amounts by region is straightforward. The crucial condition is unambiguous membership: at the relevant point in time, each fact row must contribute once to each level of the intended rollup.
The familiar calendar is a balanced hierarchy. In the image below, every month sits within a quarter, and every quarter sits within a year. Each branch has the same kinds of levels.

For your listing dimension, an agreed country_code, region_code, and city_code can work similarly. The fact table joins to the listing’s surrogate key; the listing row supplies all three reporting levels. Repeated country and region values are intentional. They let a report author group sales by region without first navigating separate city, region, and country tables.
Read the Microsoft Fabric guidance for the rationale behind that choice and its definition of a balanced hierarchy.
Modeling Dimension Tables in Warehouse - Microsoft Fabric
Microsoft Fabric’s dimension-table guide connects flattened hierarchies to reporting usability. Read this portion to distinguish a hierarchy’s logical levels from the number of physical tables used to store them.
In “Dimension design concepts,” begin with “Denormalization vs. normalization” at the sentence “It's almost always the case that dimension tables should be”. Read the hierarchy discussion through “Snowflake dimensions,” “Hierarchies,” and the end of “Balanced hierarchies.” Focus on why repeated higher-level labels can be useful, and why a fact’s grain determines the level at which it joins the hierarchy. The intervening snowflake discussion is context, not an instruction to split every hierarchy into tables.
Balanced does not mean “one table per level.” It describes the shape and meaning of the levels. A single wide dimension table can represent that shape. Nor does it mean that a label such as “Quarter 1” is globally unique: a reporting key must distinguish Quarter 1 in one year from Quarter 1 in another. The same caution applies to city names reused in different regions.
Ragged hierarchies: a named level does not exist on every branch
Now consider a hierarchy in which one branch reaches further down than another.
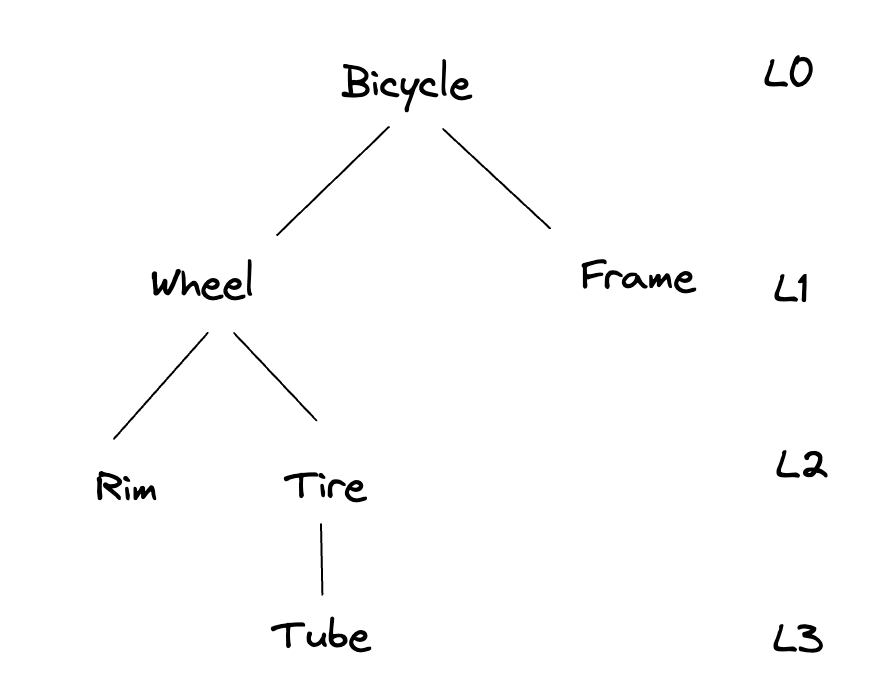
In this image, Frame is a valid component even though its branch ends at the first component level. Tube is reached through Wheel and Tire. Adding an invented subcomponent beneath Frame would make the drawing rectangular, but it would not make the product structure more truthful.
A common analytical case is a ragged positional hierarchy: the business has named levels, but an intermediate level is inapplicable on some branches. Imagine reporting geography with country, administrative_area, and city. Country A uses administrative areas; Country B does not. A listing in Country B still has a city, but it has no genuine administrative-area value.
A flattened listing dimension can retain columns for the named levels:
listing_key | country | administrative_area | city
------------+---------+---------------------+-------
801         | A       | Area X              | City 1
802         | B       | Not applicable      | City 2
Here “Not applicable” is a deliberate status, not a place. It differs from unknown: unknown means an applicable value could not be determined. You can group both rows by country or by city, but a report titled “Sales by administrative area” must state how Country B’s sales are shown. They might appear in a clearly labelled “No administrative area” bucket; they must not silently be attributed to a fictitious area.
Some reporting tools instead fill a missing positional level by repeating its parent’s label. That can make navigation display cleanly, but the repeated label is a presentation convention, not evidence that the missing level exists. Keep the business meaning explicit in the model or semantic layer.
Microsoft Fabric describes both variable-depth parent-child structures and missing positional levels. Read the short adjoining sections to see where the distinction matters.
Modeling Dimension Tables in Warehouse - Microsoft Fabric
Return to Microsoft Fabric’s guide for its “Unbalanced hierarchies” and “Ragged hierarchies” subsections. These distinguish a variable chain of members from a hierarchy whose named intermediate level is skipped.
In “Unbalanced hierarchies,” start at “An unbalanced hierarchy has levels based on a parent-child relationship.” Read variable-depth guidance through the first paragraph of “Ragged hierarchies.” Pay particular attention to how parent-child depth comes from relationships between rows, whereas a ragged geography has an inapplicable named level. The following geography example illustrates the latter case.
Terminology is not perfectly uniform: ragged is sometimes used broadly for any uneven-depth tree. For design decisions, specify the actual condition instead: Is a named level missing, or can any member have another member as its parent? Those conditions call for different data checks and different ways of presenting a rollup.
Parent-child hierarchies: the depth comes from the rows
An organizational structure need not have permanently defined columns called “Division,” “Department,” and “Team.” A unit may report to another unit of the same kind, and some chains are longer than others. That is a parent-child hierarchy.
Watch how the organizational example establishes the one-parent assumption, then turns a variable-length path into named levels for reporting. The demonstration uses DAX; you need the modeling idea, not its formula syntax.
PowerBi & DAX - Parent Child Hierarchies (Part I)
Watch “PowerBi & DAX - Parent Child Hierarchies (Part I)” by BA Sensei to see both the variable-depth structure and one way to present it as levels.
Watch the structure for the single-parent, variable-depth examples. Then watch flattening levels, where parent identities are used to populate separate reporting columns. Focus on the relationship represented by those columns, not on memorizing DAX functions.
Suppose dim_org contains one row per organizational unit. Its org_key identifies the row; parent_org_key refers to another row in the same dimension. A root has no parent. Unlike the listing’s fixed country/region/city columns, the reporting depth here comes from following those references.
| org_key | unit | parent_org_key | Direct sales amount |
|---|---|---|---|
| 1 | Unit A | null | 10 |
| 2 | Unit B | 1 | 20 |
| 3 | Unit C | 1 | 30 |
| 4 | Unit D | 2 | 40 |
| 5 | Unit E | 2 | 50 |
Assume each direct sales amount represents a separate, additive contribution assigned to that unit. A rollup for Unit B and all its descendants totals 110: Unit B’s 20 plus Units D and E’s 40 and 50. Counting only terminal units would incorrectly omit B’s own sales. Unit A’s full-tree total is 150.
For a modest hierarchy in PostgreSQL, a recursive query can obtain the members of B’s subtree before joining to sales facts:
WITH RECURSIVE subtree AS (
    SELECT org_key
    FROM dim_org
    WHERE org_key = 2                 -- Unit B

    UNION ALL

    SELECT child.org_key
    FROM dim_org AS child
    JOIN subtree AS parent
      ON child.parent_org_key = parent.org_key
)
SELECT SUM(f.sales_amount) AS subtree_sales
FROM sales_fact AS f
JOIN subtree AS s
  ON s.org_key = f.org_key;
This query includes Unit B because the starting row is part of subtree. It produces the intended total only if each unit has at most one parent in this reporting hierarchy, there are no cycles, and the fact’s org_key identifies exactly one unit. Those are data-model constraints, not SQL optimizations. If a unit has two parents, a naïve rollup can count the same sale twice.
For repeated reporting over a larger tree, recursively discovering descendants for every query may be inconvenient. Two common alternatives, not requirements to implement together, are:
- Naturalized level columns: derive ancestor labels into columns on the dimension when the reporting depth is bounded and those levels have a useful presentation meaning.
- Ancestor–descendant bridge: store pairs such as
(ancestor_org_key, descendant_org_key), including each unit paired with itself. A report joins the chosen ancestor to its descendants, then to facts assigned to those descendants. The bridge must be governed carefully to avoid duplicate paths and double counting.
Neither alternative requires turning each organizational level into a separate snowflaked dimension table. Also, a hierarchy can change over time. A rollup of historical sales needs an explicit decision about whether it uses membership at the time of sale or today’s organization; changing the parent pointer without that decision can silently restate history. We will address change policies later in this module.
Snowflaking is a storage choice, not a cure for an uneven hierarchy
A snowflake splits a dimension’s descriptive levels across related tables. For example, rather than keeping category_name and subcategory_name on each product row, it gives category and subcategory their own tables. That resembles a normalized operational design, but a report grouping fact rows by category must now traverse more relationships.
Watch this concise visual comparison.
Watch “Dimensional Modeling” by Bryan Cafferky for a visual contrast between a flattened star and a hierarchy split into a snowflake.
Watch the snowflake. Notice the separately stored month, location, and product classifications. Concentrate on the extra navigation imposed on a report author; treat performance as something to test for your database and workload, not as a universal guarantee from the diagram alone.
For a typical analytical dimension, start with a flattened, descriptive row. That was the previous lesson’s choice for listing geography, and it remains suitable for a balanced hierarchy or a ragged one with an explicitly handled missing level. Splitting country, region, and city into separate tables would not resolve uncertainty about where a listing belongs, nor would it clarify what “no administrative area” means.
There are reasons to consider a separate table: a very large reusable classification maintained independently, an agreed shared reference dimension, or a measured workload that benefits from a different physical structure. Even then, you can expose a flattened view to report authors. The design decision needs a demonstrated benefit that outweighs added join and navigation complexity.
A compact review rule is:
| Observed shape | First modeling choice | Check before reporting |
|---|---|---|
| Same meaningful levels on every branch | Explicit levels on a flattened dimension row | Each lower member has one intended parent |
| Named level inapplicable on some branches | Explicit levels with a clear missing-level convention | “Not applicable” is not confused with “unknown” |
| Members have other members as parents; depth varies | Parent reference; optionally naturalized levels or a governed ancestor bridge | One-parent rule, cycles, and contributions from non-leaf members |
The common thread is rollup correctness. A fast query that duplicates facts or attributes them to an invented member is not an improvement.
Conclusion
A balanced hierarchy has consistently meaningful levels; a ragged hierarchy can skip an inapplicable named level; and a parent-child hierarchy derives its variable depth from relationships among members of the same dimension. Flattened dimension attributes are usually the clearest reporting surface. Use a parent reference or an ancestor bridge when the relationships demand it—not a snowflake by default.
Next, you’ll design a date dimension and expose distinct business dates through role-playing views. The balanced calendar pictured here will become a reusable dimension; its different roles will need equally clear meanings in the fact table.