Recommended resources
The freely available resources this lesson will direct you to.
- CAGR explainedwww.youtube.com
- Calculate Percentage in Excel the Right Way | Percentage Difference Formulawww.youtube.com
- How to Calculate Percentage Change in Excelcorporatefinanceinstitute.com
- A Financial Statement Analysis - Principles of Accounting, Volume 1: Financial Accounting | OpenStaxopenstax.org
Hello! Your research plan specifies which company and peer figures you need. Now you need to turn those figures into comparisons you can defend. A growth rate is only useful if its starting year is right; a margin is only comparable if its profit definition matches; and a market share is only meaningful if the company’s sales belong in the market total.
This lesson covers six measures you are likely to use in your first company brief: percentage change, CAGR, margins, market share, market concentration, and indexed growth. Allow about 40 minutes, including the short resources and a small Excel schedule. The examples are invented; they demonstrate calculations, not findings about a real company.
Start with the question behind the denominator
Most errors in these measures are not arithmetic errors. They come from dividing by a number that answers a different question.
Suppose a company’s revenue rises from 100 to 120, in millions of currency units. Its absolute change is 20 million. Its percentage change asks how large that increase was relative to the starting revenue:
Here, . Dividing by 120 instead would answer a different question: what fraction of current revenue the increase represents.
Leila Gharani’s Calculate Percentage in Excel the Right Way shows the equivalent spreadsheet formulas and a small Excel-entry trap worth avoiding.
Calculate Percentage in Excel the Right Way | Percentage Difference Formula
Watch this short explanation to connect the starting-value denominator to an Excel formula and to see how Excel stores percentages.
Watch percentage change for the calculation. Then watch Excel percentages for the difference between entering a rate such as 20% and entering a number that is later formatted as a percentage.
In Excel, =B3/B2-1 returns 0.20; percentage formatting displays it as 20%. Do not multiply by 100 and apply percentage formatting, or the displayed result will be 100 times too large.
For your brief, attach a period and a metric to every statement: “FY2022 revenue grew 20% from FY2021” is more informative than “growth was 20%.” If the starting value is zero, percentage growth is undefined—not automatically 100%. If it is negative, a conventional growth percentage can become counterintuitive; show the starting and ending amounts and explain the change instead. A positive change is not automatically good, either: rising revenue and rising costs have different implications.
Use CAGR for endpoints, not for the path between them
Now extend the illustrative revenue series:
| Financial year | Revenue, millions | Change from prior year |
|---|---|---|
| FY2021 | 100 | — |
| FY2022 | 120 | 20% |
| FY2023 | 150 | 25% |
Revenue rose 50% in total from FY2021 to FY2023. That journey contains two annual intervals, not three: FY2021–FY2022 and FY2022–FY2023. The compound annual growth rate, or CAGR, is the constant annual rate that would produce the same endpoints:
where annual intervals. Using because the table contains three years would understate the rate.
The Finance Storyteller makes the endpoint-versus-path distinction particularly clear in CAGR explained.
Watch this explanation to see why compound growth needs a count of intervals and why CAGR must not be mistaken for each actual year's result.
Begin with compounding. Continue through CAGR's limitation, then the formula and Excel calculation. Notice that intermediate years do not enter the CAGR formula.
In the example, 22.5% CAGR does not mean revenue grew 22.5% in either year; the observed rates were 20% and 25%. For a company comparison, report the endpoint years and inspect the annual series alongside CAGR. Two businesses can have identical CAGR despite very different volatility or a recent slowdown.
Use like-for-like endpoints: the same revenue definition, currency basis, reporting perimeter, and fiscal-year duration. An acquisition or accounting change may make a mathematically correct CAGR a poor description of underlying growth. Note such a break rather than silently treating the rate as organic growth.
Margins compare performance within a period
Growth compares a metric across time. A margin compares a profit measure with revenue in the same period. If FY2023 revenue is 150 million and consistently defined operating profit is 18 million:
That says 12 units of operating profit were reported for every 100 units of revenue. It does not say profit grew 12%.
OpenStax’s Financial Statement Analysis explains this kind of within-period, or “vertical,” comparison and then introduces profit margin. Read those parts for the denominator logic; our example uses operating profit rather than the resource’s broader profit-margin example.
A Financial Statement Analysis - Principles of Accounting, Volume 1: Financial Accounting | OpenStax
Read the OpenStax sections on vertical analysis and profit margin to distinguish a margin from a year-over-year growth rate.
In “Vertical Analysis,” read the explanation, from its opening definition through the income-statement base amount. Then, under “Profitability Ratios” and “Profit Margin,” read the interpretation. Focus on why sales is the denominator and why the numerator must be named.
If FY2022 operating profit was 12 million on revenue of 120 million, its margin was 10%. The move from 10% to 12% is an increase of 2 percentage points. It is also a 20% relative increase in the margin because . State which comparison you mean; “margin increased 2%” is ambiguous.
“Margin” alone is not a sufficiently precise workbook label. Gross, operating, and net margins use different profit numerators. Before comparing companies, check whether their reported operating-profit measures include the same kinds of items and whether both figures use consolidated—or both use standalone—reporting. A higher margin may be relevant to your decision, but it does not by itself establish superior cash generation.
Market share and concentration need a defined market
A company’s market share measures its part of a defined market’s sales:
The numerator and denominator must use the same product scope, geography, period, and measurement unit. Unit sales divided by revenue is not a share; nor are sales in one region divided by a worldwide market total.
Consider an invented market measured in units. In FY2022, Company A sold 200 units in a market of 800: its share was 25%. In FY2023, it sold 240 units in a market of 1,000: its share was 24%. A’s unit sales grew 20%, yet its share fell by 1 percentage point, because the market grew 25%. The relative change in share was . These are distinct statements.
The spreadsheet image below demonstrates the division used for share and a second comparison called relative market share. Treat its figures as an illustration of formulas, not as verified market evidence: the market denominator’s scope and the companies’ reported sales scopes would need checking before publication.

Relative market share has a competitor in the denominator, not the entire market. In our invented FY2023 market, if Company B sold 360 units, A’s share is 24% and B’s is 36%. A’s relative share versus B is : A sold about two-thirds as many units as B within that market. When two shares use precisely the same market total, this is equivalent to . It is not a 0.67% share of the overall market.
Market concentration asks a different question: how much of the market is held by its largest firms? One simple measure is the three-firm concentration ratio, or :
Suppose FY2023 units are B: 360, A: 240, C: 200, and all remaining firms together: 200. The total is 1,000. B, A, and C are the three largest (no firm in the remaining group can exceed its entire 200-unit total), so . This establishes that those three account for 80% of this defined unit market in FY2023. It does not, alone, establish pricing power, profitability, or the reason concentration arose.
Do not call an “Other” bucket the third-largest firm. If the underlying competitors are unknown and the bucket could conceal a larger firm, first resolve the rankings or describe the concentration estimate as incomplete.
Put the measures in a traceable Excel schedule
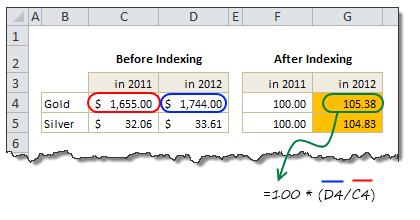
Indexed growth gives different-sized series a shared starting point. Choose a base period, assign its value an index of 100, and calculate:
Our revenue series of 100, 120, and 150 has index values of 100, 120, and 150 when FY2021 is the base. An index of 150 means 50% above the base value, not 150% growth. It still takes a separate comparison to say FY2023 was 25% above FY2022.
The following image shows why indexing can help you compare growth paths even when the original series have very different scales.
You can build a small, auditable version in Excel. Label the figures below illustrative. In columns A–C, enter:
| Cell/column | A: Fiscal year ending | B: Revenue, millions | C: Operating profit, millions |
|---|---|---|---|
| Row 2 | 2021 | 100 | 8 |
| Row 3 | 2022 | 120 | 12 |
| Row 4 | 2023 | 150 | 18 |
Add these calculation columns. Enter formulas rather than typing the resulting percentages:
| Column | First formula to use | What to check |
|---|---|---|
| D: Revenue change | In D3: =B3/B2-1; copy to D4 |
Displays 20%, then 25% |
| E: Full-period CAGR | In E4: =(B4/B2)^(1/(A4-A2))-1 |
Displays about 22.5%; two annual intervals |
| F: Operating margin | In F2: =C2/B2; copy through F4 |
Displays 8%, 10%, 12% |
| G: Revenue index, FY2021 = 100 | In G2: =B2/$B$2*100; copy through G4 |
Displays 100, 120, 150 |
Format D–F as percentages; leave G as index numbers. The anchored $B$2 keeps the base-year denominator fixed when you copy the index formula. In a real workbook, keep source references beside your raw figures or in a linked source register. Do not label a calculated figure “reported.”
For the market calculations, make a separate area headed “FY2023 unit market—illustrative”: total 1,000; A 240; B 360; C 200; remaining firms collectively 200. First verify that the components sum to 1,000. Then calculate each firm’s share using the same total cell as an anchored denominator, and sum the three largest shares for . Keep the FY2022 A volume of 200 and market total of 800 alongside it if you want to show the share change. This separation prevents the revenue figures, stated in millions of currency units, from being accidentally mixed with unit-market figures.
Before transferring any result to a chart or report, read its label aloud with its denominator: “FY2023 operating profit as a percentage of FY2023 revenue”; “A’s FY2023 units as a percentage of defined-market units.” If that sentence sounds wrong, inspect the formula and inputs.
Key takeaways
The calculation is only as defensible as its denominator, period count, metric definition, and market scope. Percentage change uses the starting value; CAGR uses endpoint values and the number of intervals; a margin divides a named profit measure by same-period revenue. Market share requires matching market sales, concentration requires correctly ranked firms, and an index compares each observation with a fixed base.
Your Excel schedule can now turn the previous lesson’s research plan into traceable comparisons. Next, you will use peer medians, quartiles, dispersion, and outlier checks to judge whether a company’s results are distinctive rather than merely different from one selected peer.