Recommended resources
The freely available resources this lesson will direct you to.
Hello! Last lesson followed how an mRNA sequence determines the amino acid sequence of a polypeptide. This lesson shifts to a different question about genetic information: which version of a gene might an offspring inherit from each parent? You’ll use Punnett squares and probability to predict outcomes for a single gene. Allow about 35–40 minutes for the lesson, video and selected reading.
From alleles to observable traits
An allele is a version of a gene. For the single gene considered in a monohybrid cross, an offspring inherits one allele from each parent. Its pair of alleles is its genotype; the observable characteristic is its phenotype. These are not interchangeable: two offspring can have different genotypes but the same phenotype.
In the simple dominant–recessive model used here, we write a dominant allele with a capital letter and a recessive allele with the corresponding lowercase letter. Suppose produces yellow pea seeds and is dominant to , which produces green seeds. The three possible genotypes have these meanings:
| Genotype | Description | Phenotype |
|---|---|---|
| Homozygous dominant | Yellow | |
| Heterozygous | Yellow | |
| Homozygous recessive | Green |
Homozygous means the two alleles are the same; heterozygous means they differ. In this model, an offspring needs two alleles to show the recessive, green phenotype. A yellow seed, however, could have either or . Dominance tells you how alleles affect the phenotype—not which allele an offspring is more likely to inherit.
Read the opening of OpenStax’s Characteristics and Traits for the distinction between genotype and phenotype and the meaning of dominance.
12.2 Characteristics and Traits - Biology 2e | OpenStax
OpenStax uses Mendel’s pea plants to show why an organism’s visible trait does not always reveal both of its alleles.
In “Phenotypes and Genotypes,” begin with the pea-plant account. Continue into “Dominant and Recessive Alleles,” ending with the dominance explanation, just before the human-inheritance table. Focus on why a heterozygote can resemble a homozygous dominant organism.
The model matters. Not every characteristic follows simple complete dominance, so use a capital–lowercase interpretation when the question states or establishes that inheritance pattern.
A Punnett square represents possible fertilisations
To predict offspring, first work out what allele each parent can place in a gamete—an egg or sperm cell. When the alleles separate during meiosis, a parent can produce gametes carrying or . For this simple cross, each has a probability of . A parent produces only -carrying gametes.
A Punnett square pairs every gamete possibility from one parent with every possibility from the other. Watch Nicole Lantz’s Probabilities and Punnett Squares to see the setup before you read the cells as probabilities.
Probabilities and Punnett Squares
Nicole Lantz uses a recessive-condition example to demonstrate a cross between two heterozygous parents and then combines outcomes that give the same phenotype.
Watch the square setup, paying attention to what the labels outside and inside the grid represent. Then watch adding outcomes for the distinction between one genotype and either of two genotypes.
Consider a cross between a heterozygous yellow-seeded plant and a green-seeded plant: . Put one parent’s possible gametes across the top and the other’s down the side:
The two row labels are deliberately identical: the parent can supply only . Repeating that label makes a four-cell grid convenient; it does not mean this parent has two different gamete types.
Two cells contain and two contain . Thus the predicted genotype ratio is , and the phenotype ratio is yellow: green. Each phenotype has a , or , probability for an offspring.
Now change the parents to . Each can supply or , so the square is:
There are two routes to : one parent can supply while the other supplies , or their contributions can be reversed. Count both cells. The resulting genotype ratio is . Because and are both yellow, the phenotype ratio is yellow: green.
Read the corresponding crosses in OpenStax to connect the grid to segregation into gametes. Stop before the article moves on to further crosses.
12.2 Characteristics and Traits - Biology 2e | OpenStax
Return to OpenStax for its worked yellow-versus-green pea-seed crosses, including why the two heterozygous cells count separately.
Under “The Punnett Square Approach for a Monohybrid Cross,” start at the paragraph introducing yellow and green seeds. Read the worked crosses, stopping before the paragraph beginning “Mendel validated these results.” Compare the all-Yy offspring of YY \times yy with the 1:2:1 genotype ratio from Yy \times Yy.
The contrast is important for exams: is not the ratio for every monohybrid cross. It results from two heterozygous parents under this dominance model. You must establish the parental genotypes before predicting a ratio.
Why the square agrees with probability
A Punnett square is a visual probability calculation. In the cross, an offspring is only if one parent supplies and the other also supplies . Each contribution has probability ; for these independent contributions, multiply:
This is the product rule, useful when both specified events must happen. In the four-cell square, the cell represents that same probability.
For a yellow offspring, the question is different: the offspring could be or . These are mutually exclusive outcomes for one offspring, so add their probabilities:
This is the sum rule: add the probabilities of alternative outcomes when only one of them can occur in the same fertilisation. The image below uses and instead of and , but shows the same heterozygote-by-heterozygote reasoning. Its three shaded cells include one and two possibilities.
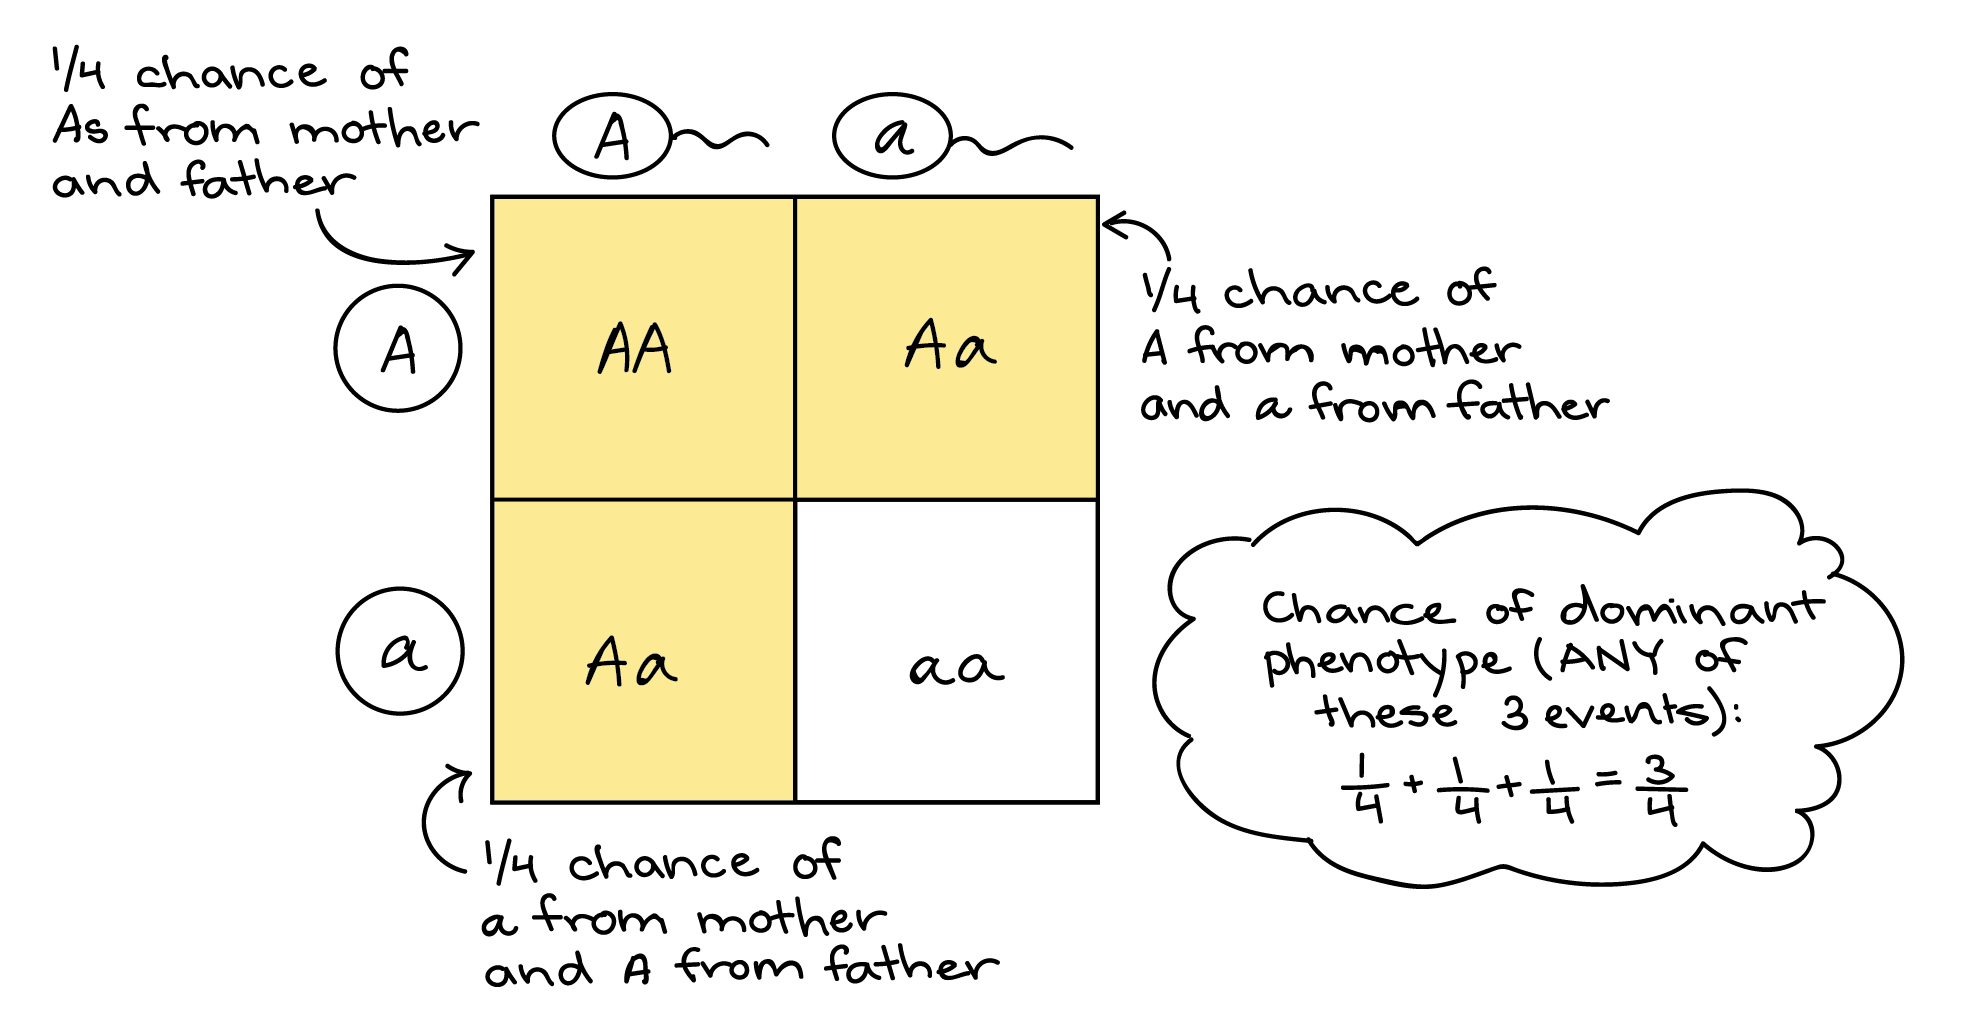
For a closer look at why multiplication applies within a cell and addition applies across suitable cells, read the single-gene examples in Khan Academy’s Probabilities in genetics. The later multi-gene material is beyond today’s cross.
Probabilities in genetics (article)
Khan Academy explains the probability operations hidden inside a Punnett square.
In “The product rule,” read the rule and single-gene example; focus on the two parental contributions needed to make aa. Then, in “The sum rule of probability,” read the rule and dominant-phenotype example. Stop before “The product rule and the sum rule”; you do not need the later dihybrid crosses here.
These probabilities describe likelihoods, not a guaranteed batch of four offspring. A probability of means that each offspring in this model has a one-in-four chance of that genotype. It does not mean that every four offspring must include exactly one . Observed ratios can differ from predictions, especially in small groups.
Turning a cross into an HSC prediction
A strong prediction shows enough working that a marker can see where the answer came from. For a question stating that yellow seeds are dominant and the parents are both heterozygous, a compact response would be:
Let represent the dominant yellow-seed allele and the recessive green-seed allele. Both parents are , so each can produce - and -carrying gametes. A Punnett square for gives , , and . The predicted genotype ratio is ; because both and produce yellow seeds, the predicted phenotype ratio is yellow: green. The probability that an offspring has green seeds is , or .
Notice the order of the reasoning. Define the alleles and parental genotypes, identify the possible gametes, combine them, and translate genotypes into the phenotype the question asks about. If a question asks specifically for the probability of , report , not the probability of the yellow phenotype. Keep the requested ratio’s labels and order clear.
Key takeaways
For a monohybrid cross, each parent contributes one allele for the gene being considered. A Punnett square displays their possible combinations; the inheritance pattern then lets you convert genotype predictions into phenotype predictions. Multiply independent parental contributions to find a particular combination, and add mutually exclusive combinations when more than one produces the requested outcome. Treat every ratio as a prediction, not a promise about a small number of offspring.
Next lesson, you’ll work in the other direction: using pedigrees and offspring ratios as evidence to infer an inheritance pattern rather than starting with both parental genotypes known.