Recommended resources
The freely available resources this lesson will direct you to.
- 14.3 Reaction Mechanisms, Catalysts, and Reaction Coordinate Diagrams | General Chemistrywww.youtube.com
- Potential Energy Diagrams - Chemistry - Catalyst, Endothermic & Exothermic Reactionswww.youtube.com
- 17.7 Catalysis - Chemistry: Atoms First | OpenStaxopenstax.org
- 3.6: Day 23- Reaction Mechanisms - Chemistry LibreTextschem.libretexts.org
Welcome to the final module of this course, where the focus shifts from whether a reaction is possible to how it proceeds. A reaction-coordinate diagram is a compact map of a reaction mechanism: it shows the energetic barriers encountered as reactants become products. By the end of this lesson, you will be able to read such a map to identify transition states, intermediates, activation energies, the rate-determining step, and the change introduced by a catalyst.
Plan for about 35–40 minutes: first learn the diagram-reading conventions, then analyze a multistep pathway, and finally compare catalyzed and uncatalyzed routes.
1. Reading the map: axes, endpoints, and peaks
A reaction-coordinate diagram plots energy vertically against reaction coordinate horizontally.
- The vertical axis represents the energy of the chemical system. Depending on the context, it may be labeled potential energy, enthalpy, or Gibbs free energy.
- The horizontal axis is not time. It simply tracks progress through the molecular rearrangements that convert reactants into products.
- The horizontal levels at the far left and far right are the reactants and products.
The difference between reactant and product energy is the overall energy change. In a diagram labeled with enthalpy, it is:
If products lie below reactants, the reaction is exothermic and is negative. If products lie above reactants, it is endothermic and is positive. This endpoint difference describes the reaction overall; it does not tell you how fast the reaction will happen.
The rate depends on the hills between those endpoints.
14.3 Reaction Mechanisms, Catalysts, and Reaction Coordinate Diagrams | General Chemistry
Watch “14.3 Reaction Mechanisms, Catalysts, and Reaction Coordinate Diagrams” from Chad’s Prep for a concise visual walkthrough of diagram features, multistep mechanisms, and rate-determining steps.
Watch diagram analysis. Focus especially on the distinction between a peak and a valley, and on why the activation energy for a later step must be measured from the preceding intermediate rather than from the original reactants.
At the top of each hill is a transition state, also called an activated complex. It is the fleeting, high-energy arrangement of atoms at the critical point of a particular elementary step. A transition state is not an isolable substance: the system either falls back toward the preceding species or proceeds downhill toward the next one.
The energy required to reach a transition state is an activation energy, . For a one-step reaction,
A larger activation energy usually means that, at a given temperature, fewer molecular encounters have enough energy to surmount the barrier. The reaction is therefore slower.
2. Multistep reactions: peaks, valleys, and local barriers
A mechanism with several elementary steps produces several hills and valleys. The useful pattern is:
| Diagram feature | Mechanistic meaning |
|---|---|
| Each peak | One transition state |
| Each valley between peaks | One reaction intermediate |
| Number of peaks | Number of elementary steps |
| Number of intermediates | One fewer than the number of steps |
An intermediate is formed in one elementary step and consumed in a later one. Unlike a transition state, it corresponds to a local energy minimum and may sometimes be detected or isolated under suitable conditions. It does not appear in the overall balanced equation because it is produced and later used up.
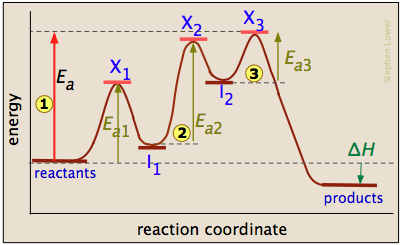
The three-step diagram above is especially important because it prevents a common mistake: you do not measure every activation energy from the original reactants.
For its three steps:
Notice that is the highest peak in absolute energy, but step 3 begins at the relatively high-energy intermediate . Its barrier may therefore be smaller than that of step 2. The barrier for step 2 is the large climb from to .
This is why the shortcut “the tallest peak is always the slowest step” is unsafe. The reliable rule is:
For each step, compare the transition-state energy with the energy of the species immediately preceding it. The step with the largest activation-energy barrier is generally the slowest.
In the illustrated three-step pathway, step 2 has the largest local activation energy, . It is therefore predicted to be the rate-determining step.
3. The rate-determining step: the bottleneck in a mechanism
The rate-determining step—also called the rate-limiting step—is the slowest elementary step in a mechanism. It limits the rate at which the entire sequence can produce product.
Think of a multistep reaction as an assembly process: later stages cannot continually outpace the slowest stage that supplies material to them. If the formation of an intermediate is slow, a later rapid reaction of that intermediate cannot sustain a faster overall product formation rate than the intermediate’s supply allows.
For standard general-chemistry reaction-coordinate problems, identify the rate-determining step by following this procedure:
- Start at the reactants.
- Identify the first transition state and calculate or estimate its barrier from the reactant level.
- Move to the next valley, which is the intermediate.
- Measure the next barrier from that intermediate to the next transition state.
- Compare the barriers. The largest one corresponds to the rate-determining step.
The connection between activation energy and rate comes from the fact that molecules have a distribution of kinetic energies. At a fixed temperature, only some collisions have enough energy to reach a particular transition state. Raising the barrier decreases that fraction substantially.
In real kinetics, features such as molecular orientation, solvent, concentrations, and frequency factors can matter too. Thus, a diagram is a simplified representation, and experimental rate data ultimately test a mechanism. But when a diagram is provided in introductory chemistry, the largest local activation-energy barrier is the intended indicator of the rate-determining step.
4. What a catalyst changes—and what it does not
A catalyst speeds a reaction by providing an alternative mechanism with a lower activation energy. The catalyst participates in the individual steps but is regenerated by the end, so it is not consumed in the net reaction.
17.7 Catalysis - Chemistry: Atoms First | OpenStax
Read the catalyst discussion in OpenStax Chemistry: Atoms First to connect alternate mechanisms, lower activation energy, and equilibrium behavior.
In Section 17.7, find the paragraph immediately after the discussion of commercial ammonia-production conditions, beginning with the alternate mechanism. Read through the discussion of Figure 17.24. Focus on the fact that a catalyzed route can contain more elementary steps, transition states, and intermediates while still having lower barriers overall.
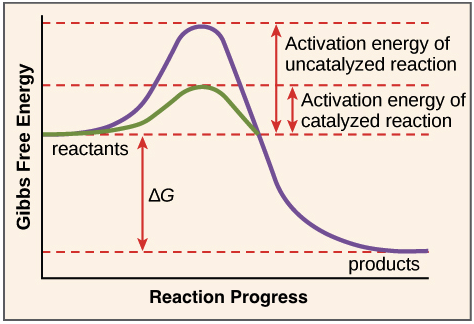
The diagram makes four major points.
A catalyst lowers the barrier, not the endpoints
The catalyzed and uncatalyzed pathways begin with the same reactants and end with the same products. Therefore, a catalyst does not change the overall energy difference between reactants and products.
- On a potential-energy diagram, it does not change the overall .
- On a Gibbs-free-energy diagram, it does not change the overall .
- It does not change the equilibrium constant or the equilibrium composition.
A catalyzed mechanism may have more steps
A lower-energy route need not be a single smooth hill. A catalyst often interacts with a reactant to form one or more intermediates, then is regenerated in later steps. Thus, a catalyzed curve can have more peaks than an uncatalyzed curve, yet still be faster because its relevant barriers are lower.
The catalyst speeds both directions
The same alternative pathway can be traversed from products back to reactants. Consequently, a catalyst lowers activation energies for both the forward and reverse reactions. It helps the system reach equilibrium sooner; it does not make equilibrium favor products over reactants.
Compare barriers from their appropriate starting levels
When comparing catalyzed and uncatalyzed routes, do not merely count peaks or compare the absolute height of every point. Compare the activation-energy barriers for each pathway from the relevant reactant or intermediate level. The route with the lower kinetically important barrier is the faster route.
A compact diagram-analysis routine
When you encounter a new reaction-coordinate diagram, annotate it in this order:
- Mark reactants and products. Compare their energies to determine whether the overall reaction is exothermic or endothermic.
- Count peaks. Each peak is a transition state and corresponds to one elementary step.
- Mark interior valleys. These are intermediates.
- Find each activation energy locally. Measure upward from reactants or the preceding intermediate to the next transition state.
- Locate the largest local barrier. This step is the predicted rate-determining step.
- If two pathways are shown, inspect the endpoints. Identical endpoints with a lower alternate barrier indicate catalysis.
- State the catalyst’s limits. It changes rate and mechanism, but not the net reaction’s thermodynamic endpoint difference or equilibrium position.
You can now translate the shape of a reaction-coordinate curve into mechanistic claims: peaks are transition states, interior valleys are intermediates, local climbs are activation energies, and the greatest climb identifies the rate-determining step. A catalyst offers a different route with lower barriers while leaving reactant and product energy levels unchanged.
This completes the course’s core sequence: represent reactions correctly, assess their thermodynamic direction, and then interpret the mechanisms and kinetic barriers that govern how rapidly they occur.