Recommended resources
The freely available resources this lesson will direct you to.
Hello! This course begins with yes/no data: first we will turn recorded outcomes into events and probabilities, then build toward chance rules, repeated trials, p-values, and comparisons across groups. In this lesson, you will define exactly what counts as a “yes,” calculate its observed share in pandas, and distinguish that share from the probability you hope to learn about.
A yes/no column describes an event
Suppose each row records one observation, and a column says whether a particular outcome occurred. Before calculating anything, specify the event: the statement whose chance interests you. If the statement is “the flag is True,” then a row with True is an occurrence of the event; a row with False is not.
A single observation has an outcome. The event is a rule for classifying outcomes. For this binary measurement, the possible recorded outcomes are True and False, and the event “flag is True” contains just one of them. Probability expresses how likely that event is on a scale from to .
3.4 Probability Theory - Principles of Data Science | OpenStax
Read OpenStax’s introduction to events and relative-frequency probability. It supplies the vocabulary behind the pandas calculations we will make.
In Section 3.4, start with the opening paragraph on probabilities between 0 and 1. Continue through the definitions of outcome, sample space, and event; then read the “Relative Frequency Probability” subsection and Example 3.14, including its Solution. Read definitions and example, stopping before Example 3.15. Focus on what the numerator counts and what population the denominator represents.
Consider this five-row DataFrame. Its columns show two common ways to store binary information: integers (0 and 1) and Booleans (False and True).
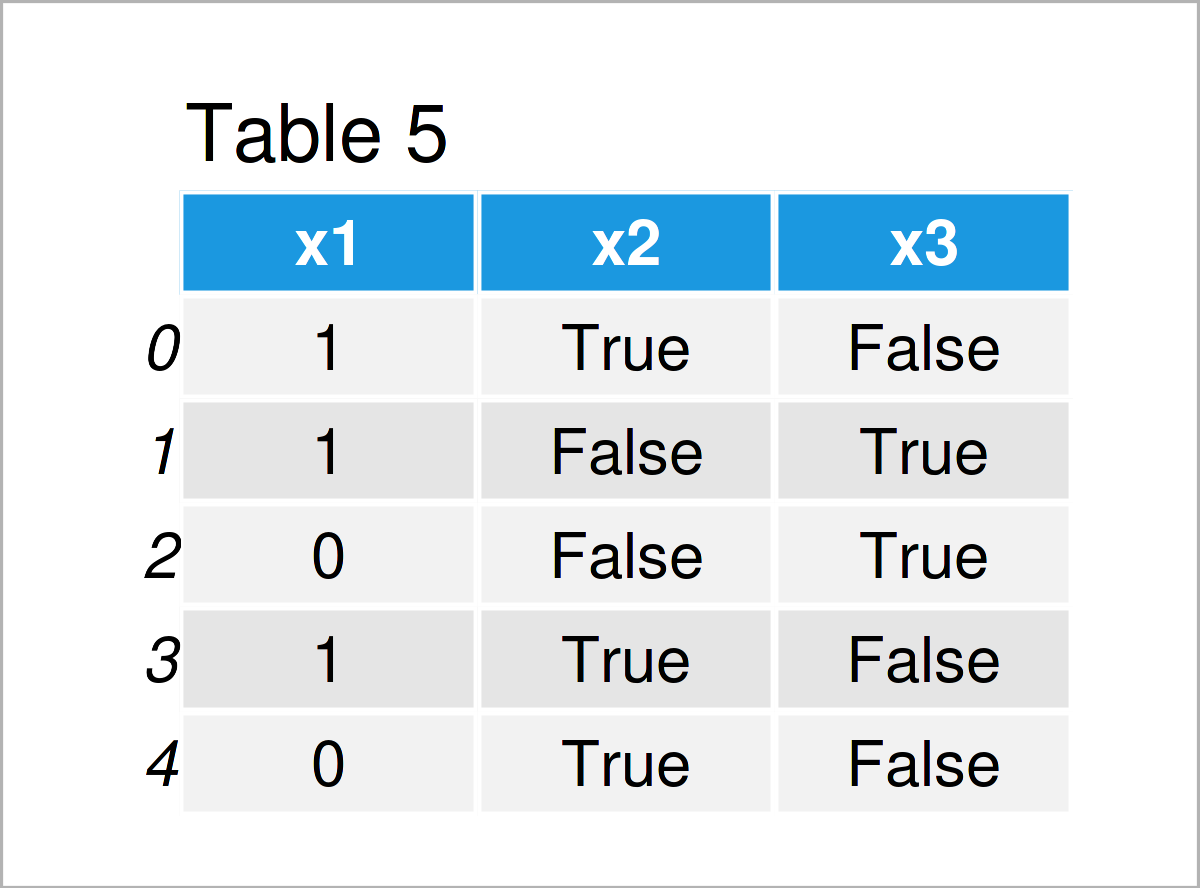
If you select one of these five rows uniformly at random, the probability that its x2 value is True is exactly . That is a statement about selection from these recorded rows. It does not automatically mean that a new observation will have a True value with probability .
Notice also that x1 contains three 1s. Its observed share happens to equal the share of True values in x2, but the two columns do not mark the same rows. An event must therefore include both a condition and the variable to which it applies: “x1 equals 1” and “x2 is True” are different events.
Estimating probability with pandas
For a dataset of observed yes/no outcomes, the basic estimate is the relative frequency:
Here, is the event count and is the number of eligible observations. The hat on means estimate: the fraction comes from data, rather than from knowing the underlying probability in advance.
Pandas offers two useful views of the same calculation. value_counts() shows the counts; value_counts(normalize=True) divides them by the number of nonmissing values by default.
pandas.Series.value_counts — pandas 3.0.5 documentation
Read the pandas documentation for Series.value_counts to see how counts become relative frequencies, and how missing values affect the denominator.
Under “pandas.Series.value_counts,” read the method description and the normalize parameter: counts and normalization. Then, in “Examples,” find “With normalize set to True” and read its example through the dropna explanation: examples and missingness. Pay particular attention to the default exclusion of missing values.
Now take a small dataset in which the last outcome was not recorded:
import pandas as pd

df = pd.DataFrame({
    "outcome": [
        True, False, True, True, False,
        True, False, False, True, pd.NA
    ]
})

event = df["outcome"].astype("boolean")

n = event.notna().sum()
k = event.sum()
assert n > 0

p_hat = k / n
print(f"Event count: {k}; observed outcomes: {n}")
print(f"Estimated probability: {p_hat:.3f}")
There are five True values, four False values, and one missing value. Thus , , and , or approximately . The missing row is not silently classified as False: we do not know whether the event occurred there.
You can inspect and reproduce that calculation in two other ways:
print(event.value_counts(dropna=False))       # True: 5, False: 4, <NA>: 1
print(event.value_counts(normalize=True))    # True: 5/9, False: 4/9
print(event.mean())                           # 5/9
The mean works because pandas treats True as and False as for this calculation, while skipping missing values. The count-and-denominator version is often preferable when reporting a result: “5 out of 9 observed outcomes” makes the evidence behind visible.
The denominator answers a question, not just a coding detail. With normalize=True, the question is: “Among rows with a known outcome, what share are True?” If you instead run event.value_counts(normalize=True, dropna=False), the True share is . That answers a different question: “What share of all ten records are confirmed True?” Neither command can tell you the unknown value in the missing row. Decide which question you mean before choosing the denominator.
The same principle applies when data arrives as 0/1 or as strings such as "yes"/"no": define which value means the event occurred, and check for unexpected or missing values before taking a mean. In particular, averaging a numeric column estimates an event frequency only when its eligible values really are coded as and .
What the estimate can—and cannot—claim
The fraction is an exact description of the nine recorded outcomes. Calling it an estimate of the probability for a future or broader population requires an additional judgment: are these rows reasonably representative of the observations you care about? If the data systematically omits certain outcomes, the arithmetic can be correct while the estimated probability is misleading.
Even with a sensible sampling process, a small dataset can produce a share different from the probability that generated it. This short simulation makes that distinction visible without introducing a new probability rule:
import numpy as np

rng = np.random.default_rng(7)

for _ in range(3):
    batch = pd.Series(
        rng.choice([False, True], size=10, p=[0.4, 0.6])
    )
    print(f"{int(batch.sum())} out of {len(batch)}: {batch.mean():.2f}")
In this simulated setting, the chance of True was set to , but each batch contains only ten observations. The printed shares need not equal . In a real dataset, the direction of reasoning is reversed: you see the share but do not know the underlying probability. Later lessons will put numbers on that uncertainty. For now, keep the observed fraction, its denominator, and the event definition together whenever you report a rate.
Key takeaways
A binary event is a precisely stated condition on an observation, such as “this column is True.” Its empirical probability estimate is the event count divided by the number of eligible observed outcomes. In pandas, counts, normalized counts, and the mean of a clean Boolean column can express that calculation—but missing-value handling determines what the denominator means. An observed share describes the data exactly; its usefulness for predicting new observations depends on how those data were obtained.
Next, you will consider chances involving either of two events, including why their probabilities cannot always be added without accounting for overlap.