Recommended resources
The freely available resources this lesson will direct you to.
- Merging DataFrames in Pandas | Python Pandas Tutorialswww.youtube.com
- Python Pandas Tutorial (Part 8): Grouping and Aggregating - Analyzing and Exploring Your Datawww.youtube.com
- pandas GroupBy: Your Guide to Grouping Data in Python – Real Pythonrealpython.com
- Merging and Aggregating Data Cheatsheetwww.codecademy.com
Hello! Last lesson, you derived token counts from an AI request log and filtered it to answer a question about individual requests. Now you’ll answer questions about groups of requests—such as total tokens by model—and attach information stored in a separate table. Allow about 40 minutes to watch the selected video segments, run the code, and inspect the results.
Turn request rows into model summaries
A filter keeps or removes individual rows. An aggregation does something different: it reduces several rows to a summary value. For example, five successful requests might become three rows, one per model, with a request count and total token usage for each.
Corey Schafer’s video Python Pandas Tutorial (Part 8): Grouping and Aggregating introduces the “split, apply, combine” idea and shows how one or several statistics can be calculated for each group.
Python Pandas Tutorial (Part 8): Grouping and Aggregating - Analyzing and Exploring Your Data
Watch Corey Schafer group survey responses and calculate statistics by country. His countries play the same role that model names will play in our request log.
In forming groups, focus on what groupby() produces before an aggregation is applied. Then watch grouped statistics for the transition from one statistic to several with .agg(). You can skip the intervening survey analysis.
Create aggregate_merge_demo.py alongside your previous script. Re-create the small request table so this script runs independently:
import pandas as pd


requests = pd.DataFrame(
    [
        [101, "small", "ok", 120, 30, 800],
        [102, "large", "ok", 500, 100, 2100],
        [103, "small", "error", 260, 0, 500],
        [104, "small", "ok", 400, 130, 1800],
        [105, "large", "ok", 80, 25, None],
        [106, "experimental", "ok", 200, 60, 900],
    ],
    columns=[
        "request_id",
        "model",
        "status",
        "input_tokens",
        "output_tokens",
        "latency_ms",
    ],
)

requests["total_tokens"] = (
    requests["input_tokens"] + requests["output_tokens"]
)
successful = requests.loc[requests["status"] == "ok"]
We filter before aggregating because the question is about successful requests. Including request 103 would change the "small" model’s totals. The order of operations is part of the meaning of the result, not just a coding detail.
Now add:
summary = successful.groupby("model", as_index=False).agg(
    request_count=("request_id", "size"),
    total_tokens=("total_tokens", "sum"),
    avg_latency_ms=("latency_ms", "mean"),
    measured_latencies=("latency_ms", "count"),
)

print(summary)
Read each named aggregation as output name, followed by source column and operation. For each model, "size" counts rows, "sum" totals tokens, and "mean" averages recorded latencies. as_index=False leaves model as an ordinary column, which will make merging easier.
The expected values are:
| model | request_count | total_tokens | avg_latency_ms | measured_latencies |
|---|---|---|---|---|
| experimental | 1 | 260 | 900 | 1 |
| large | 2 | 705 | 2100 | 1 |
| small | 2 | 680 | 1300 | 2 |
The "large" model illustrates a distinction worth keeping: it has two successful requests but only one recorded latency. "size" counts its rows; "count" on latency_ms counts non-missing values. Its mean latency therefore describes the one measured request, not both requests. Missing latency did not prevent request 105’s tokens from contributing to total_tokens.
You can group by more than one column when the question calls for it. For example, this summary keeps successful and failed requests separate within each model:
by_model_and_status = requests.groupby(
    ["model", "status"], as_index=False
).agg(
    request_count=("request_id", "size"),
    total_tokens=("total_tokens", "sum"),
)

print(by_model_and_status)
Here, "small" has an "ok" group with two requests and 680 tokens, and an "error" group with one request and 260 tokens. The grouping columns determine what counts as “one group”; the aggregation determines what you report about it.
Attach information from another table
Suppose token rates are maintained separately from request logs. You want to add a rate to each model summary without copying that rate into every request row. That is a merge: match rows from two DataFrames using a shared key.
Watch the selected parts of Alex The Analyst’s Merging DataFrames in Pandas. Pay particular attention to specifying the key explicitly with on, rather than relying on pandas to choose shared column names.
Merging DataFrames in Pandas | Python Pandas Tutorials
Watch Alex The Analyst demonstrate merge() with a shared identifier and compare which rows different merge types retain.
In keys and matches, note the difference between letting pandas infer matching columns and supplying on. Then watch merge types for outer, left, and right merges. Stop before the cross-join example.
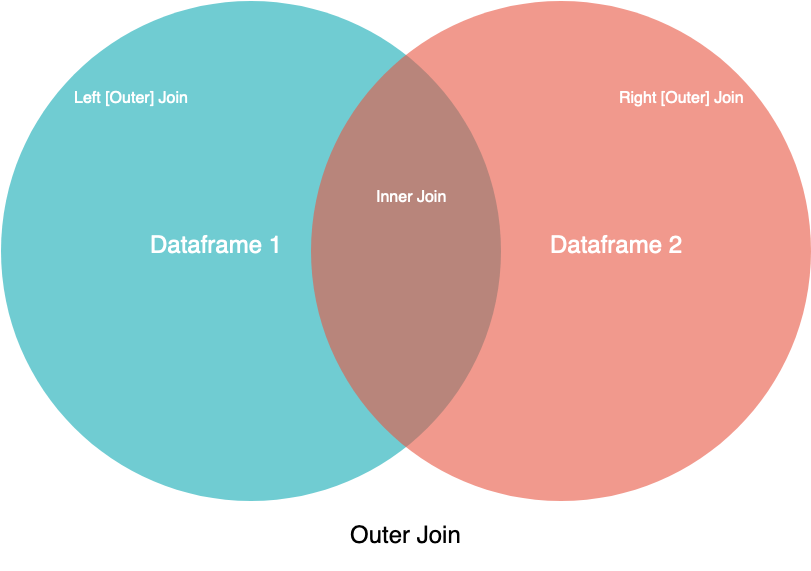
This image is a useful first picture of which keys each merge type includes:
Add a small rate table to your script. These rates are illustrative; actual services may charge separately for input and output tokens.
pricing = pd.DataFrame(
    {
        "model": ["small", "large", "retired"],
        "usd_per_1k_tokens": [0.002, 0.005, 0.003],
    }
)

enriched = summary.merge(
    pricing,
    on="model",
    how="left",
    validate="many_to_one",
)

print(
    enriched[
        ["model", "request_count", "total_tokens", "usd_per_1k_tokens"]
    ]
)
summary is the left table and pricing is the right table. on="model" says that model names, not row positions, establish matches. A left merge preserves every row in summary and adds a rate where pricing has the same model:
| model | request_count | total_tokens | usd_per_1k_tokens |
|---|---|---|---|
| experimental | 1 | 260 | missing |
| large | 2 | 705 | 0.005 |
| small | 2 | 680 | 0.002 |
The experimental model has no listed rate, so its summary remains but its rate is missing. Choosing an inner merge instead would drop that model. An outer merge would also include "retired" from the rate table, even though it has no successful requests in this log. A right merge would keep all rate-table models but not "experimental". The right choice depends on which unmatched records the question requires you to retain.
Once the tables are joined, you can calculate a value that needed columns from both:
enriched["estimated_usd"] = (
    enriched["total_tokens"]
    / 1000
    * enriched["usd_per_1k_tokens"]
)

print(enriched[["model", "total_tokens", "estimated_usd"]])
The "small" estimate is 0.00136 USD and the "large" estimate is 0.003525 USD under these toy rates. The experimental estimate stays missing. Treating it as zero would silently turn “rate unknown” into “no cost,” which is a different claim.
Check what a merge actually did
A matching key does not guarantee one output row per input row. If pricing accidentally contained two "small" rows, a merge would match the "small" summary to both and duplicate it. Summing the merged total_tokens column afterward could then overstate usage.
That is why the example specifies validate="many_to_one": multiple rows are allowed on the left, but each model key must appear at most once in the right-hand rate table. Pandas raises an error if that expectation is violated. It happens that this particular summary also has unique model keys, but the same validation remains appropriate if you later merge rates directly onto the many-row request log.
When you need to investigate unmatched keys on either side, use an outer merge with an indicator:
audit = summary.merge(
    pricing,
    on="model",
    how="outer",
    indicator=True,
    validate="many_to_one",
)

print(audit[["model", "_merge"]])
The _merge column marks "small" and "large" as both, "experimental" as left_only, and "retired" as right_only. This makes the missing rate and the unused rate-table entry visible before either can be overlooked in a report.
Takeaways
Use groupby() when many rows must become a statistic per key; use .agg() to name several statistics in one summary. Decide which rows belong in the calculation before grouping, and distinguish a group’s row count from the count of non-missing measurements.
Use merge() when related columns live in separate tables. Specify the matching key and choose how according to which unmatched rows must survive. Check key uniqueness and unmatched rows before trusting the merged result.
Next, you’ll begin querying tables with SQL. Its filtering, grouping, and joining concepts will be familiar, though the syntax and some details will differ.