Recommended resources
The freely available resources this lesson will direct you to.
Hello again! Last time, you used comprehensions to turn product records into new lists and dictionaries. Those transformations are concise, but a missing key or an unexpected value can still make them fail. This lesson is about finding why they failed: you’ll read Python error messages and tracebacks, then pause a program at a debugger breakpoint to inspect its data.
Allow about 40 minutes, including the short video, two readings, and a debugger walkthrough. This closes the Python foundations module with a skill you’ll use throughout the course: locating a problem before deciding how to fix it.
First, identify what kind of failure you have
Python can reject code before it runs. A missing colon after an if, an unclosed string, or incorrect indentation can produce a SyntaxError or IndentationError. The file, line number, and pointer show where Python detected the problem; the change you need may be just before that position.
Other code is valid Python but fails while running. For example, "2400" + 750 attempts to add a string to an integer. Python raises an exception, such as TypeError, and usually prints a traceback if nothing handles it. The exception tells you what operation failed; the traceback tells you how execution reached it.
Read the Python Tutorial’s short distinction between these two kinds of errors. Stop before “8.3. Handling Exceptions”: handling an expected failure is different from diagnosing an unexpected one, and you’ll study exception handling in the next module.
The Python Tutorial distinguishes code that cannot be parsed from code that fails during execution. Read it to establish what each kind of error message can tell you.
In Chapter 8, read subsection “8.1. Syntax Errors” from the syntax example. Notice the warning that a pointer marks where the error was detected, not necessarily where the fix belongs. Then read subsection “8.2. Exceptions” from the exception examples. Focus on the exception type, its explanatory message, and the surrounding traceback.
A third possibility is that your program runs and prints a result—but the result is wrong. That is a logic error. There may be no traceback at all. You still need to compare actual output with what you expected and inspect the values used to calculate it.
Read a traceback from the bottom, then trace the cause upward
The last line of a typical traceback names the exception and gives its message. Immediately above it, look for the file, line number, and code that failed. If several functions called one another, the earlier entries show the path of calls that led there. The failing line is where the problem surfaced; it is not always where the incorrect value originated.
Watch Python Morsels’ Traceback (most recent call last): Python’s tracebacks explained. Its example demonstrates why a fix may belong in a calling function rather than on the line that raises the exception.
Traceback (most recent call last): Python's tracebacks explained
Watch Traceback (most recent call last): Python’s tracebacks explained from Python Morsels for a compact method of reading a multi-frame traceback.
Watch the walkthrough. Start with the bottom line’s exception type and message, find the innermost failing line, then follow the earlier call frame to see where the incompatible value came from.
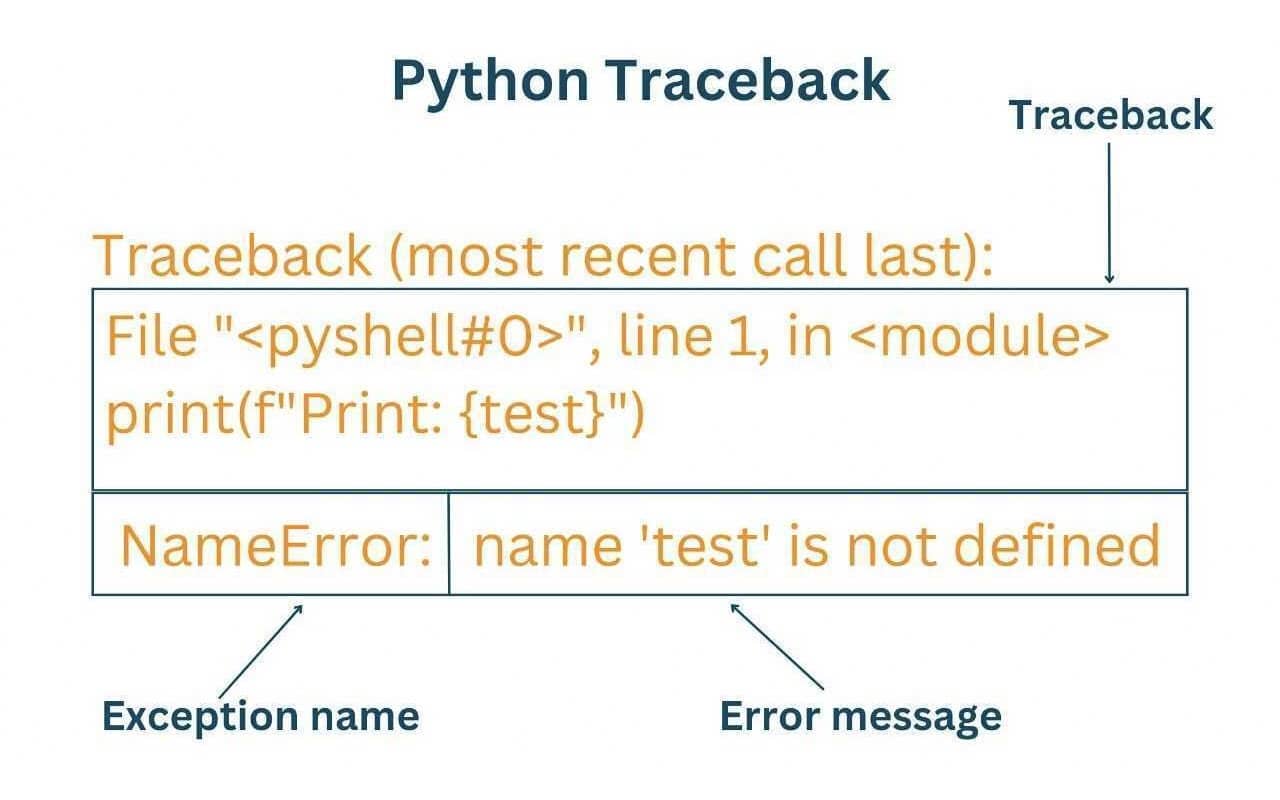
This image labels the parts of a simpler, one-frame traceback. Its final line says NameError because test was used without first being defined.
Now consider a product-total function. Save the following as debug_products.py and run it with the Python interpreter you have been using:
def available_total_cents(products):
    total = 0
    for product in products:
        if product["in_stock"]:
            total = total + product["price_cents"]
    return total


products = [
    {"sku": "A10", "price_cents": 750, "in_stock": True},
    {"sku": "B20", "price_cents": 125, "in_stock": False},
    {"sku": "C30", "price_cents": "2400", "in_stock": True},
]

print(available_total_cents(products))
You should see a traceback resembling this; file paths and pointer markings can vary:
Traceback (most recent call last):
  File ".../debug_products.py", line 14, in <module>
    print(available_total_cents(products))
  File ".../debug_products.py", line 5, in available_total_cents
    total = total + product["price_cents"]
TypeError: unsupported operand type(s) for +: 'int' and 'str'
Read upward from the bottom. The TypeError says that + received an integer and a string. The innermost frame identifies the addition in the function as the point of failure. The frame above shows the call that reached that function. Neither frame, by itself, tells you which product supplied the string—that requires inspecting the data while the function runs.
Pause before the failure with a breakpoint
A breakpoint tells a debugger to pause before executing a selected line. While paused, you can inspect the current variables rather than guessing their values from the source code. Continuing execution lets you see how those values change across loop iterations.
Read Real Python’s explanation of editor breakpoints, stopping after its description of the debugger controls. Its sample uses different data from ours; concentrate on the technique, not on its proposed fix.
How to Debug Common Python Errors – Real Python
Real Python contrasts temporary print() output with an interactive breakpoint and shows where to place one in a loop.
In “How to Debug Python Errors Using Breakpoints,” read from the paragraph beginning “Unlike print() calls” through the “Understanding Breakpoints” and “Debugging With Breakpoints” subsections, stopping after the debugger controls. Focus on the breakpoint marker in the editor margin, inspecting variables while paused, and continuing or stepping through execution.
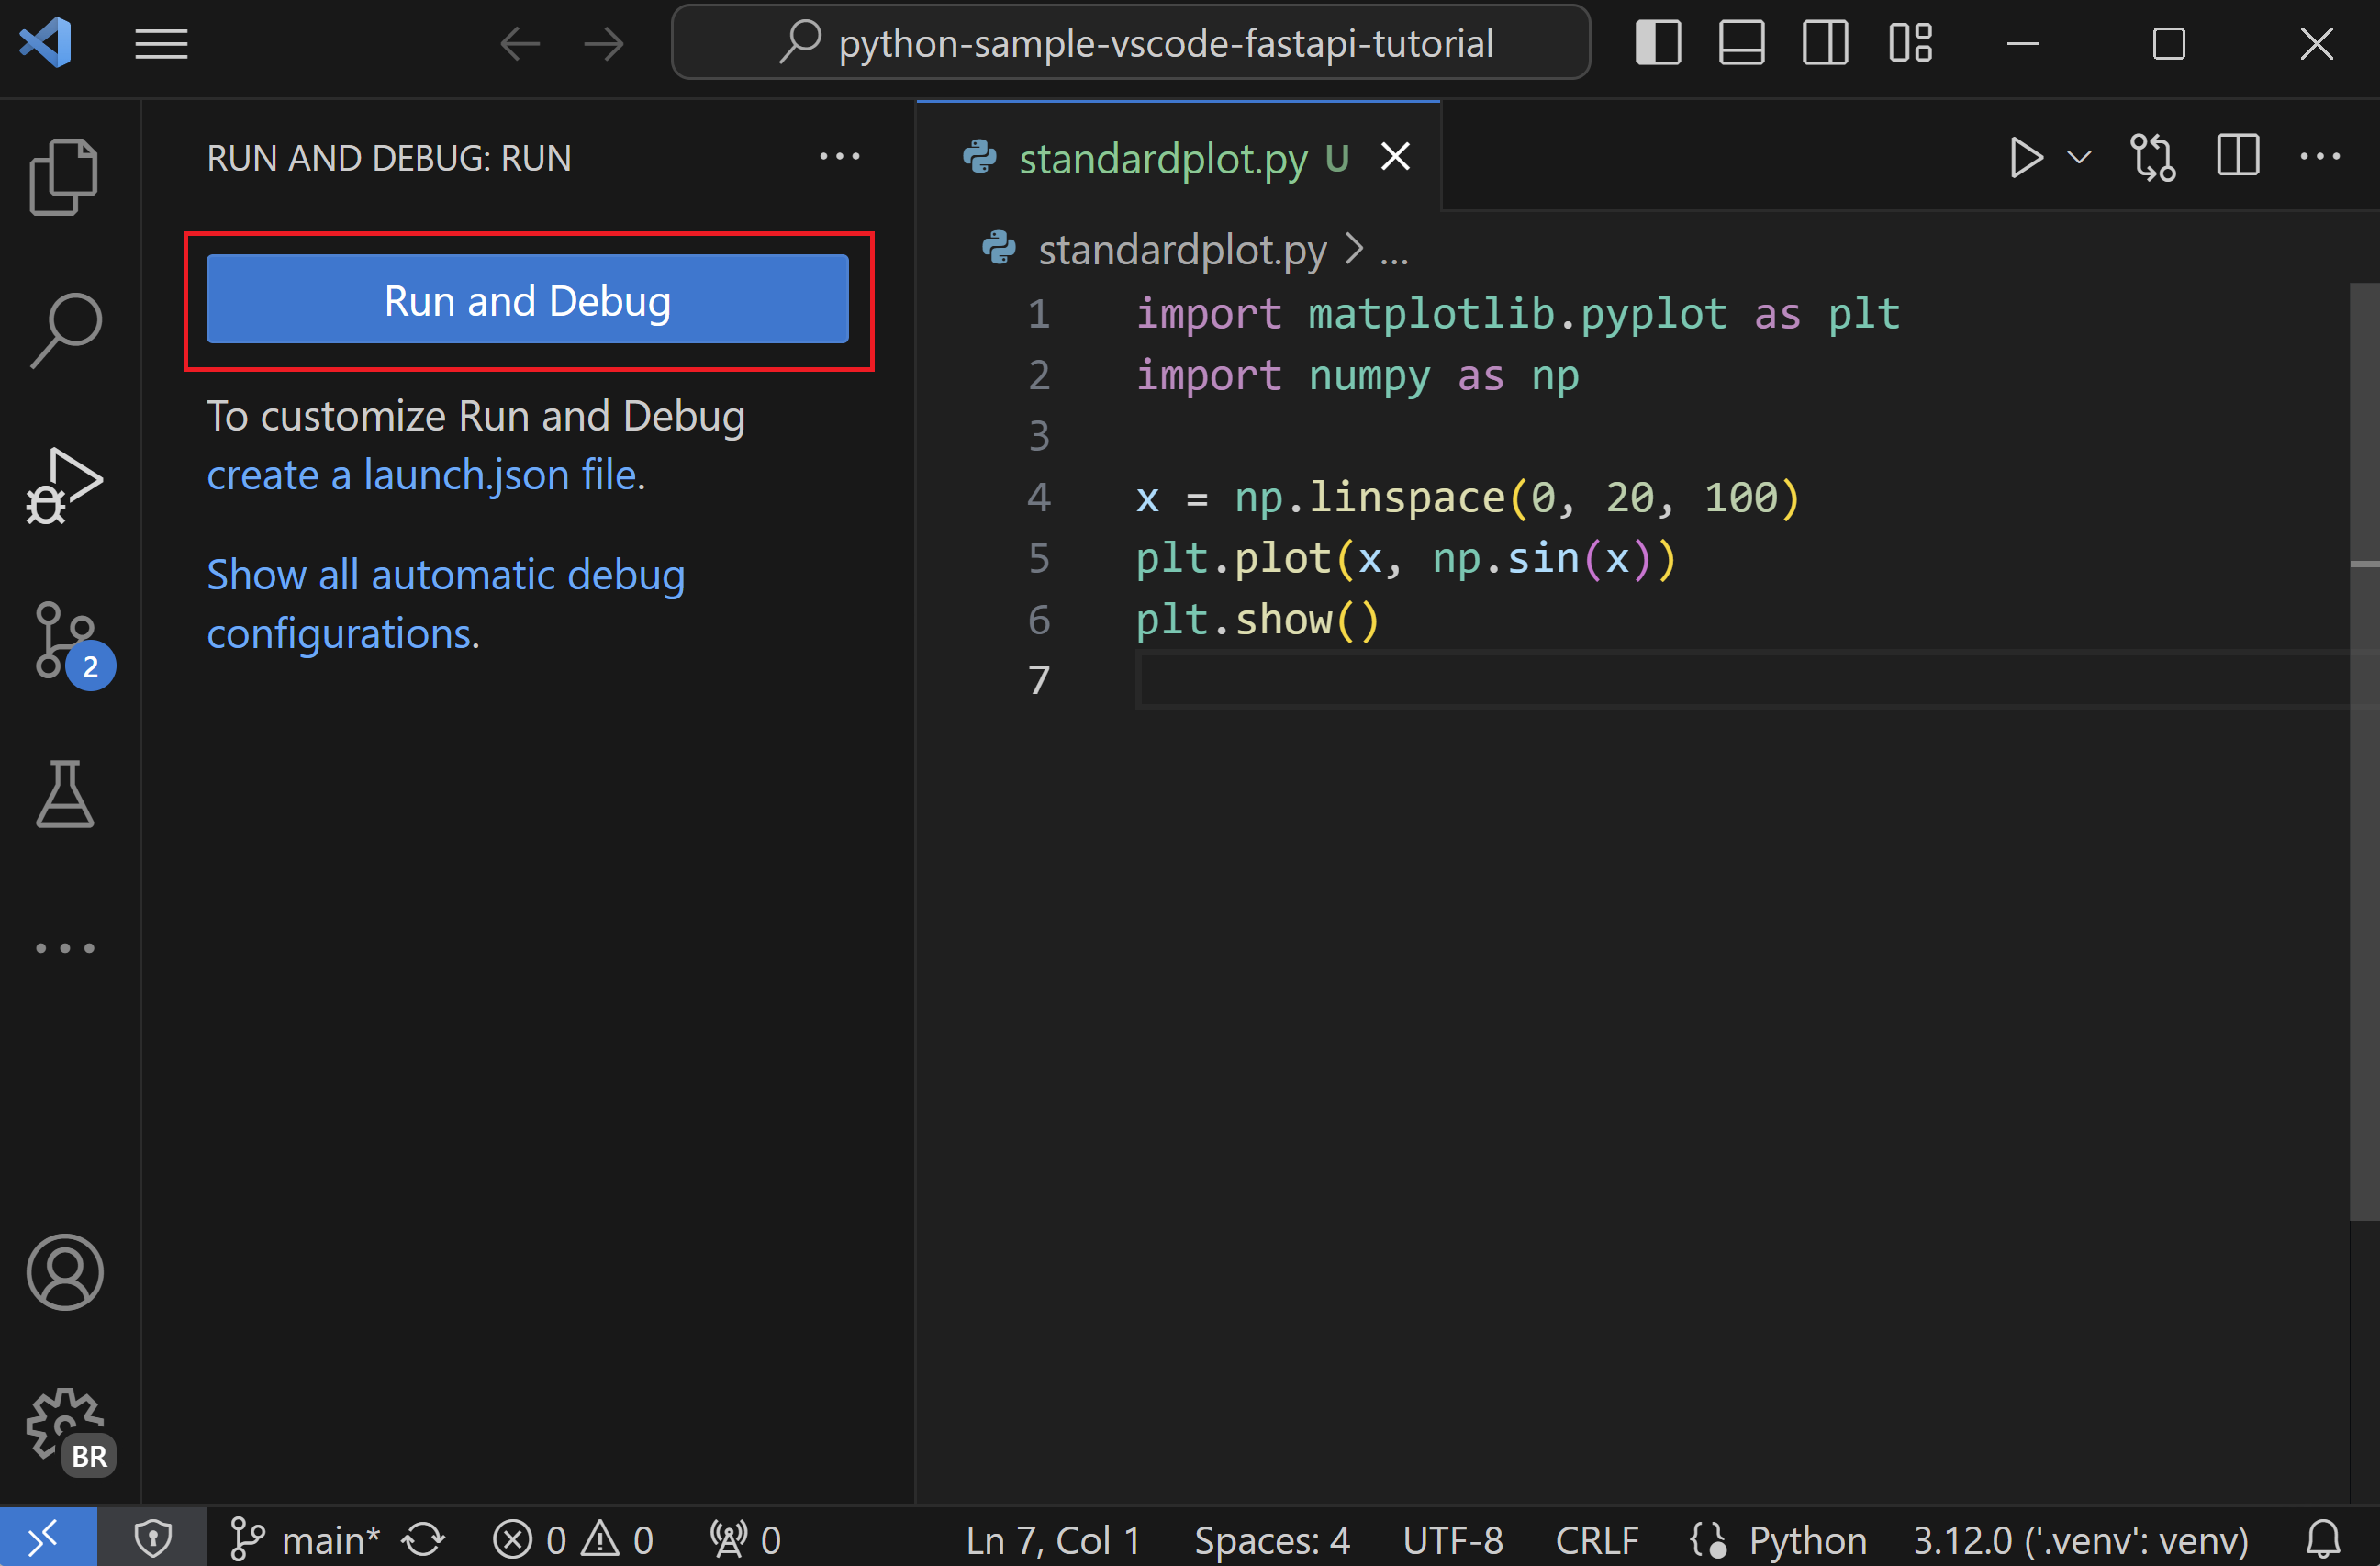
If you use VS Code, open debug_products.py, ensure it is using your Python interpreter, and click in the left margin beside the total = total + product["price_cents"] line. A breakpoint marker should appear. Open Run and Debug and start debugging the Python file; if prompted, choose the Python-file configuration. The image shows where to find the Run and Debug button.
Follow what happens in the product function:
- At the first pause, the line has not run yet.
totalis0, andproductis the"A10"record with an integer price of750. - Continue to the next time the breakpoint is reached. The out-of-stock
"B20"record skips the addition, so this pause is for"C30". Nowtotalis750, whileproduct["price_cents"]is"2400"—a string. You can inspect the value in the Variables pane and, if useful, evaluatetype(product["price_cents"])in the Debug Console. - Step Over the addition. The debugger may pause on the exception; otherwise, the run ends and the traceback appears in the terminal. Either way, you have observed the incompatible values before the failing operation.
This is the useful difference between a traceback and a breakpoint. The traceback identifies the operation that failed. The breakpoint reveals the particular iteration and variable values that made it fail. A temporary print(product, total) could also reveal those values, but a breakpoint lets you inspect them without editing the program repeatedly. You can remove the breakpoint when you finish.
In this example, the source record was written with "2400" instead of 2400. If prices in this data are intended to be integer cents, correct that record and rerun the file. The result should be 3150. If the string came from an external input instead, you would need to decide where conversion and validation belong; simply hiding the exception would leave that decision unresolved.
Use the error as a clue, not as the whole diagnosis
The same method works for other common failures in collection-processing code:
KeyError: 'price_cents'means a dictionary lookup requested a key that was absent. Check the failing lookup and the particular dictionary supplied to it.NameErrormeans Python could not find a name at that point in execution. Check spelling and whether a value was defined before use.IndexErrorpoints to a sequence position that does not exist. Inspect both the index and the sequence’s current length.ValueErrorcan arise when an operation receives a value it cannot use—for example,int("unknown"). The conversion may be on the failing line, but the unexpected text may have originated earlier.
A practical sequence is to read the final error line, locate the failing frame, inspect the input that reached it, and change the underlying cause. Then rerun the program and check the result, not merely the absence of an exception. For code that produces the wrong result without crashing, place a breakpoint before the calculation and compare the observed inputs and intermediate values with your expectations.
What to carry forward
Syntax errors stop Python from parsing code; runtime exceptions produce tracebacks when unhandled; logic errors can leave no error message at all. A traceback gives you an exception type, a message, and a path to the failing line. A breakpoint lets you pause there—or just before there—to discover which values actually reached it.
Next, you’ll begin organizing reusable Python code into modules and packages. As code spans files, the habit of following traceback frames from the failing line back through its callers will become even more valuable.