Recommended resources
The freely available resources this lesson will direct you to.
Hello. In the previous lesson, you defined competitors around a specific customer decision rather than a broad industry label. This lesson begins the enterprise-software economics module. Once you know which offerings compete, the next question is what is driving a software company’s growth?
A reported increase in recurring revenue could reflect many new customers, deeper adoption by existing customers, higher prices, or some combination that conceals substantial losses. You will build a recurring-revenue bridge that separates those effects, then use it to form sharper questions for an operating review. Allow about 40 minutes for the lesson and selected resources.
Start with a comparable revenue balance
A bridge compares recurring revenue at two points in time. Monthly recurring revenue (MRR) expresses active recurring charges on a monthly basis; an annualized recurring-revenue measure expresses the active run rate on an annual basis. Whichever measure you choose, keep its definition and customer scope consistent between the opening and closing dates.
For example, a customer paying $120,000 annually contributes $10,000 to MRR when the annual charge is normalized across 12 months. A one-time $30,000 implementation fee does not belong in that MRR balance. Nor should the $120,000 cash receipt be mistaken for revenue earned in a single month.
11 essential SaaS metrics explained in 11 minutes
Watch 11 essential SaaS metrics explained in 11 minutes from ChartMogul for the distinction between a recurring-revenue balance and cash receipts, then for the idea of tracking movements within that balance.
In MRR and cash, focus on the annual-billing example and the exclusion of one-off fees. Then skip to MRR movements for the categories that explain why the balance changes. We will separate pricing explicitly in the bridge below.
The distinction matters in a consulting analysis. A rise in billings might come from customers paying earlier without any change in their recurring commitments. Conversely, a new annual subscription can increase the recurring-revenue run rate immediately even though its revenue will be recognized over time. The bridge explains the change in the recurring-revenue balance, not the change in cash, billings, or reported revenue.
Assign each movement a cause
Suppose you take a snapshot of every customer’s recurring spend at the start and end of a period. The closing balance can be reconciled with six types of movement:
Here is recurring revenue from new customers; is expansion from existing customers; is the net pricing effect on existing subscriptions; is contraction among customers who remain active; is churn from customers who leave entirely; and is reactivation of former customers. All terms except are shown as nonnegative magnitudes. may be positive or negative.
ChartMogul’s movement definitions provide a useful starting taxonomy. Its standard expansion and contraction categories need one refinement for our purpose: isolate an identifiable price change rather than burying it in the net change to an account.
Monthly Recurring Revenue (MRR) | ChartMogul
Read ChartMogul’s Monthly Recurring Revenue (MRR) to establish what belongs in the balance and how subscription movements are normally classified.
In “Calculating monthly recurring revenue (MRR),” begin with the opening calculation guidance, then read normalization and exclusions through the one-time-fee rule. In “MRR Movements: New Business, Expansion, Contraction, Churn, and Reactivation,” read the movement table, ending at “Neutral MRR.” Focus especially on the difference between a smaller active subscription and a cancelled one.
Think of the categories as answers to different operating questions. New-customer acquisition asks how much recurring spend came from buyers who were not active customers at the start. Expansion asks whether customers bought more seats, modules, capacity, or other recurring entitlements. Contraction asks how much spend active customers shed through fewer seats, removed modules, or reduced usage. Churn asks how much recurring spend disappeared when a customer stopped being an active customer. Pricing asks what changed because the effective charge for comparable entitlements changed—not because the customer bought more or less.
Reactivation deserves its own line when material. A former customer returning is not the same event as winning a customer with no previous relationship, and combining the two can overstate genuinely new acquisition. A subscription switch at the same recurring value changes none of these balances. Decide, too, whether “customer” means a company-wide account or an account within one product: leaving one product while continuing to buy another can be product churn without being company-wide customer churn.
Build and interpret the bridge
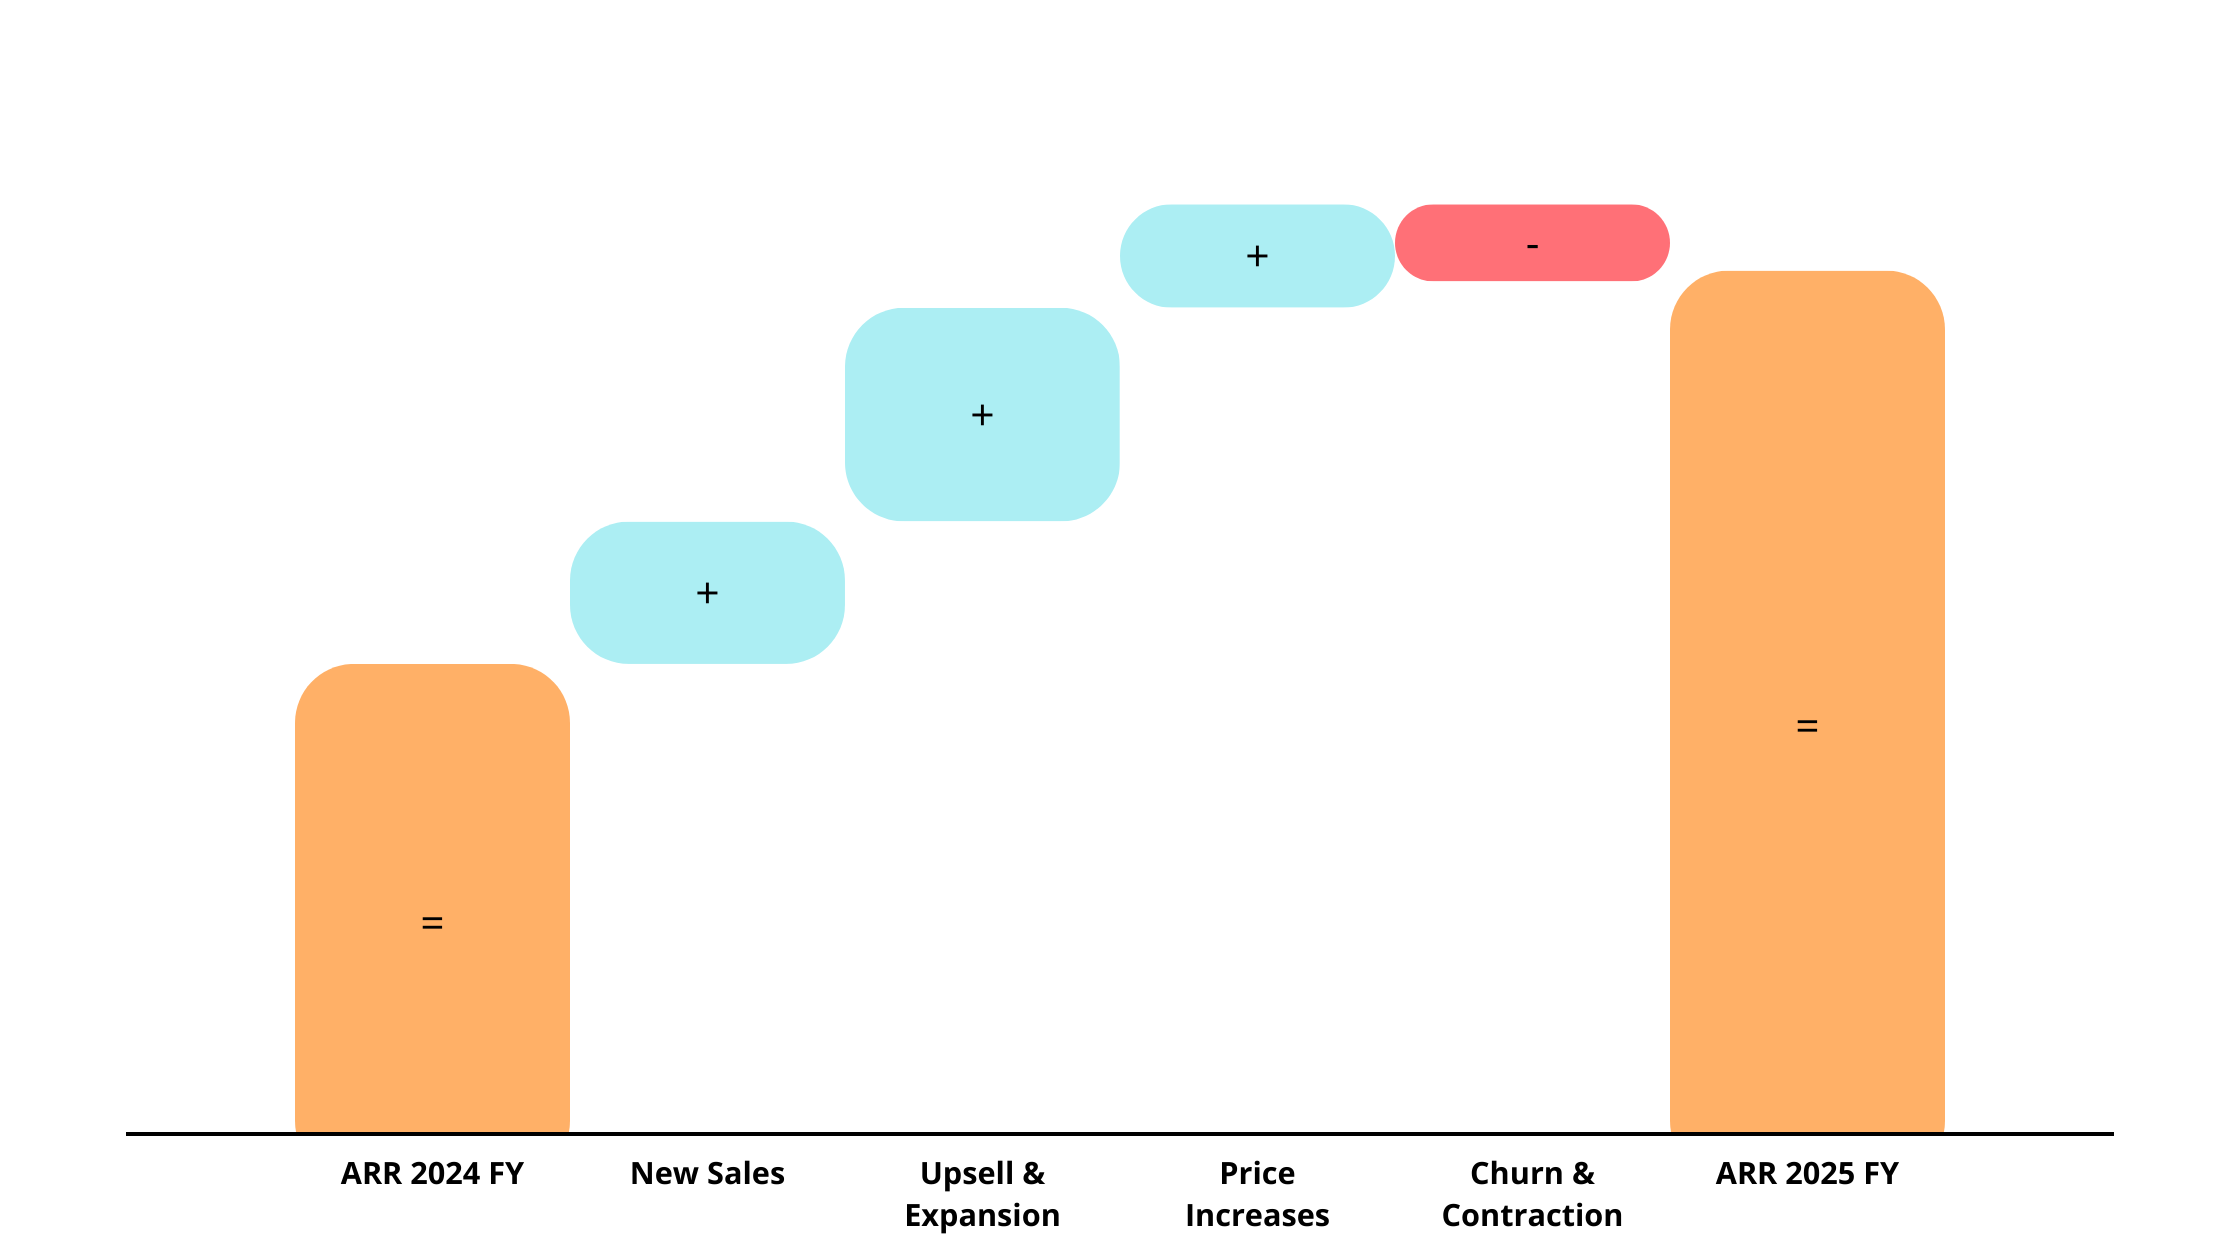
Consider a hypothetical software business with $20.0 million of opening annualized recurring revenue. Its account-level changes over the next year produce this bridge, in millions:
| Movement | Change | Running balance |
|---|---|---|
| Opening recurring revenue | — | $20.0 |
| New customers | +$5.0 | $25.0 |
| Expansion by existing customers | +$2.6 | $27.6 |
| Net pricing effect | +$0.9 | $28.5 |
| Contraction by active customers | −$0.8 | $27.7 |
| Customer churn | −$1.7 | $26.0 |
| Former customers reactivated | +$0.2 | $26.2 |
The closing balance is $26.2 million, a $6.2 million increase, or 31% growth on the opening $20.0 million. That headline is correct but incomplete. The company added $5.0 million from new customers while losing $2.5 million to contraction and churn. Existing opening customers also generated $3.5 million of expansion and price uplift; after their $2.5 million of losses, their net contribution was $1.0 million. The $0.2 million of reactivation is kept outside that opening-customer calculation.
Those distinctions lead to different hypotheses. A high new-customer contribution alongside substantial churn may point to strong acquisition but weak durability. Strong expansion with little new business may indicate effective penetration of an installed base, but raise questions about the future supply of accounts to expand. A pricing-led increase warrants investigation of renewals, discounting, and whether customers retained the same level of service. The bridge identifies where to investigate; it does not establish the cause or quality of growth by itself.
For this bridge to reconcile, classify movements using a consistent convention. An account that cancels and returns during the period could produce both a churn and a reactivation event in an event-based bridge. If you instead compare only opening and closing account snapshots, that sequence is invisible. Neither method is inherently wrong, but do not mix event totals from one method with closing balances from the other.
Separate price from quantity without double-counting
The most consequential classification choice is often price versus expansion. Imagine an existing customer starts with 100 seats at $100 per seat per month and ends with 120 seats at $110. Its MRR rises from $10,000 to $13,200: a $3,200 increase. Calling all $3,200 “expansion” would hide the price change.
One defensible convention holds the original price constant while measuring quantity, then applies the price change to the ending quantity:
Together, the two effects reconcile to $3,200. You could instead apply the new price to the extra seats and calculate pricing on the original 100; that also reconciles, but assigns the interaction between more seats and a higher price differently. State the convention and use it consistently.
The same discipline applies beyond list-price increases. An enduring discount change can create a positive or negative pricing effect. More contracted capacity at an unchanged unit rate is expansion; less capacity is contraction. A new customer signing at a higher price than previous new customers contributes to new-customer revenue, not a price uplift on the installed base. When products, tiers, and discounts change together, an aggregate “average revenue per customer” increase cannot, on its own, prove that pricing improved: the customer mix may simply have changed.
Consumption-based products need an additional policy. Usage can fluctuate without a new contract or a change in unit price. If the business includes usage-derived recurring revenue in its chosen run-rate measure, changes in usage should be classified consistently as expansion or contraction and distinguished from a true change in rate. Do not silently compare a committed-subscription ARR figure with a usage estimate built on different assumptions.
Turn the bridge into operating questions
A useful bridge is not merely a waterfall in a presentation. It is a reconciliation backed by account and subscription records. For every change, you need an opening value, a closing value, a customer identity, the date of the change, and enough detail to distinguish quantity, product, and effective price. Separate nonrecurring fees, document how annual and monthly contracts are normalized, and identify currency or acquisition effects when they would otherwise distort the comparison.
Then segment the movements rather than relying only on the company total. An enterprise segment and an SMB segment can produce the same net growth through very different combinations of acquisition and loss. Within new-customer revenue, inspect the number of customers and their starting contract sizes. Within existing-customer movements, inspect whether expansion is widespread or concentrated in a few large accounts. These cuts turn the bridge into a diagnostic for product, sales, and customer-success leaders.
Public company disclosures may not provide every line, particularly a distinct pricing effect. A filing’s subscription-revenue growth figure is not a substitute for an account-level ARR bridge. If only selected movements are disclosed, show which are observed and which remain unknown rather than inventing a residual “price” estimate: the residual could also contain usage, currency, timing, or definition differences.
Key takeaways
Recurring-revenue growth is the net result of new acquisition, expansion, pricing, contraction, churn, and, where relevant, reactivation. Define the balance first, reconcile every movement to it, and keep price changes separate from changes in what customers buy. The resulting bridge reveals whether growth comes from winning customers, deepening existing relationships, charging differently, or overcoming losses—and points to the evidence needed before making a strategic judgment.
Next, you will use the opening-customer base and these movements to calculate and interpret retention metrics, then connect acquisition economics to payback and lifetime-value ratios.