Recommended resources
The freely available resources this lesson will direct you to.
Hello! Welcome back to our study of strongly correlated systems.
In the last two lessons, we explored the Hubbard model in two different regimes. First, in the atomic limit (), we saw that a large on-site repulsion leads to electron localization, forming a Mott insulator. Then, using a mean-field approach, we found that for a partially filled band, the same interaction can drive a competition between kinetic and potential energy that results in itinerant ferromagnetism, as described by the Stoner criterion.
Today, we will bridge these two pictures by focusing on one of the most fundamental phenomena in correlated electron physics: the Mott metal-insulator transition (MIT). Our goal is to describe this transition, which occurs when a material predicted to be a metal by simple band theory is in fact an insulator due to strong electron-electron repulsion, and to understand its key experimental signatures. This topic is a cornerstone of modern condensed matter physics and has direct relevance to the optical and electronic properties you investigate in your experimental work.
1. From Atomic Levels to Hubbard Bands
Let's start by building a more precise picture of how strong correlations modify the band structure. In a simple band-theory picture, bringing atoms together causes their atomic orbitals to overlap, broadening a single energy level into a continuous band. If this band is half-filled (one electron per site), the material should be a metal. The Mott-Hubbard picture reveals why this is not always true.
The key is to consider the energy cost of adding electrons to an orbital that is already occupied.
- The energy to add the first electron to an empty orbital corresponds to the ionization energy, .
- The energy to add a second electron to that same orbital, which already contains one electron, is higher due to Coulomb repulsion. This energy corresponds to the electron affinity, .
- The difference, , is the on-site Coulomb repulsion—the familiar Hubbard .
When we form a solid, both of these energy levels broaden into bands.
- The level at broadens into the Lower Hubbard Band (LHB).
- The level at broadens into the Upper Hubbard Band (UHB).
The following video provides an excellent and intuitive explanation of this process.
Introduction to Correlated Materials. Lecture 2: The Mott-Hubbard Band Structure
This lecture by Prof. Nicola Spaldin clearly illustrates how atomic energy levels, including the Coulomb repulsion U, evolve into the Mott-Hubbard band structure in a solid.
Please watch from the beginning until 20:52. Pay close attention to: The definition of U in terms of ionization energy and electron affinity (start to 03:04). The competition between hopping (bandwidth W) and repulsion U (03:04 to 10:44). How the two Hubbard bands form and how their overlap leads to a metal-insulator transition (10:44 to 20:52).
As the video explains, the system's electronic properties are determined by the competition between the bandwidth (related to the hopping integral ) and the Coulomb repulsion .
- If : The Lower and Upper Hubbard bands are separated by a gap of order . At half-filling, the LHB is completely full and the UHB is completely empty. The material is an insulator—a Mott insulator.
- If : The bands overlap. The Fermi level lies within a region of finite density of states. The material is a metal, albeit a "correlated" one where electron interactions are still important.
The Mott metal-insulator transition is the transition between these two states, driven by changing the ratio .
2. The Nature of the Mott Transition
The Mott transition is not just a gradual opening of a band gap. It is a true phase transition with distinct characteristics. To explore these, we will refer to an excellent pedagogical text that uses the modern framework of Dynamical Mean-Field Theory (DMFT) to describe the transition.
Dynamical Mean-Field Theory and the Mott Transition
These lecture notes by Marcelo Rozenberg, 'Dynamical Mean-Field Theory and the Mott Transition,' provide a comprehensive overview of the Mott transition, its theoretical description, and its experimental realization.
First, please read Section 3, 'The Mott-Hubbard transition in DMFT' (p. 16), and Section 3.1, 'V2O3 a strongly correlated material with a metal-insulator transition' (p. 17-18). Focus on the definition of a Mott insulator at half-filling and the phase diagram of V2O3 (Fig. 8).
As discussed in the text, several key points define the Mott transition:
- It occurs in a system (like a half-filled band) that would be metallic without interactions.
- It is driven by correlation, distinguishing it from band insulators (due to fully filled bands) or Peierls/Slater insulators (due to symmetry breaking like lattice dimerization or antiferromagnetism).
- In many real materials, the transition can be driven by temperature or pressure. At finite temperature, it is often a first-order phase transition, meaning there is a discontinuous jump in properties like resistivity and a coexistence of both metallic and insulating phases.
- This first-order line terminates at a critical point, analogous to the critical point in a liquid-vapor phase diagram. This analogy is powerful: you can continuously go from the metallic "gas" to the insulating "liquid" by going around the critical point in the pressure-temperature plane. The phase diagram for V₂O₃ in Figure 8 of the reading provides a perfect experimental example of this.
3. Experimental Signatures
Your interest lies in connecting theory to experiment, and the Mott transition offers a wealth of observable signatures.
3.1. DC Resistivity
The most direct signature is a dramatic change in electrical resistivity. As a material like V₂O₃ is cooled through the transition temperature, its resistivity can jump by several orders of magnitude, signifying the abrupt localization of charge carriers and the opening of the Mott gap. The central panel of Figure 8 in the Rozenberg notes shows this classic behavior.
3.2. Spectroscopic Signatures: Seeing the Gap and Bands
Spectroscopic techniques provide a direct window into the electronic structure, allowing us to "see" the effects of correlation. Given your experience with spectroscopy, these signatures will be particularly relevant.
Photoemission Spectroscopy (ARPES): This technique measures the single-particle spectral function for occupied states (). It directly maps the electronic band structure.
- In the Mott insulating phase, ARPES would reveal the Lower Hubbard Band, separated from the Fermi level () by the Mott gap.
- In the correlated metallic phase, ARPES observes a fascinating structure: broad, "incoherent" Hubbard bands at higher binding energies, and a sharp, "coherent" quasiparticle peak at the Fermi level. This peak represents the long-lived, itinerant electronic states responsible for metallic conductivity.
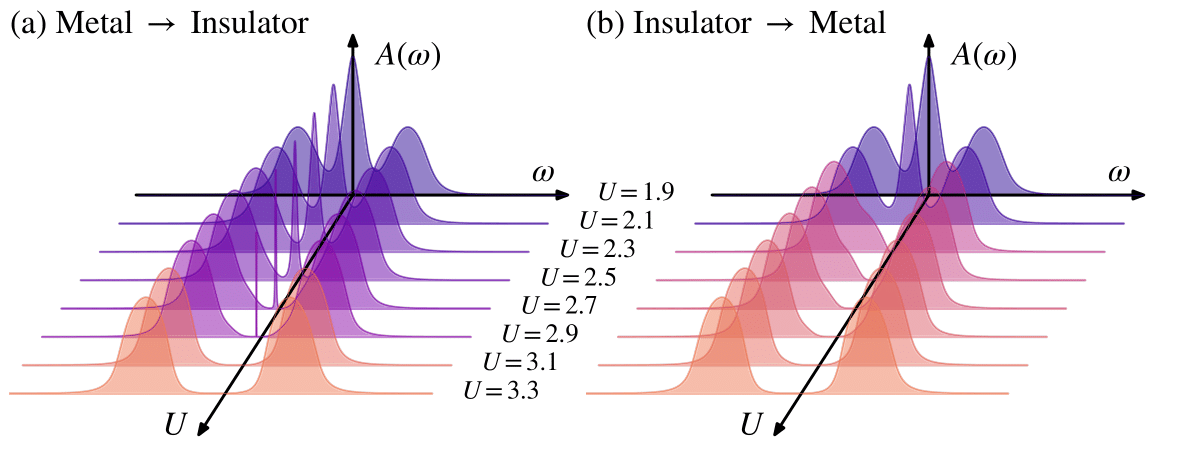
Optical Conductivity: This measures excitations created by absorbing a photon.
- In the insulating phase, the optical conductivity is zero for photon energies below the Mott gap. At , conductivity onsets as photons create excitations across the gap (effectively moving an electron from one site to a neighboring, occupied site, creating a doublon-hole pair).
- In the metallic phase, a Drude peak appears at , corresponding to the acceleration of free carriers.
A key phenomenon is spectral weight transfer. As the system approaches the transition from the metallic side (e.g., by increasing U or changing temperature), spectral weight is transferred from the high-frequency Hubbard bands into the low-frequency Drude peak and the mid-infrared region. This reflects the emergence of coherent quasiparticles.
The following paper reports on both experimental measurements and theoretical calculations of optical conductivity across the Mott transition in V₂O₃.
Optical Conductivity in Mott-Hubbard Systems - arXiv.org
This classic paper, 'Optical Conductivity in Mott-Hubbard Systems' by Rozenberg et al., directly compares theoretical predictions for optical conductivity with experimental data on V2O3, providing a clear example of an experimental signature.
Please read pages 3-5. Focus on how the theoretical picture of the DOS and optical response (Fig. 1) is used to interpret the experimental data for V2O3 (Fig. 3). Note the discussion of the 'anomalous enhancement of spectral weight' as temperature is lowered in the metallic phase—a key signature of a correlated metal.
3.3. Quasiparticle Mass Enhancement
As the MIT is approached from the metallic side, the interactions make the electrons behave as if they are heavier. This is reflected in the narrowing of the quasiparticle peak seen in photoemission. The effective mass can diverge as the transition is approached. This behavior is captured by the Brinkman-Rice picture of the transition.

This mass enhancement is also observable in thermodynamic measurements, such as a large coefficient of the linear term in the specific heat () in the correlated metal phase.
Test your understanding!
You perform a pump-probe experiment on a Mott insulator. The pump pulse is a strong, short laser pulse with photon energy less than the Mott gap. The probe measures the time-resolved optical conductivity. Immediately after the pump pulse, you observe a transient Drude-like peak at zero frequency in the conductivity spectrum. How can you explain this observation in the context of the Mott-Hubbard picture?
Show answer
Even though the single-photon energy is below the gap, a strong pump pulse can induce multi-photon absorption, exciting a significant number of electrons from the Lower Hubbard Band to the Upper Hubbard Band. This creates a population of mobile carriers: holes in the LHB and "doublons" (which can also be seen as electrons) in the UHB.
These mobile carriers can then conduct electricity, giving rise to a transient metallic state. The Drude-like peak you observe is the signature of this photo-induced population of free carriers. The decay of this peak over time reflects the recombination of these doublon-hole pairs, returning the system to its insulating ground state. This is a real experimental technique used to study the dynamics of the Mott transition, as mentioned briefly in Section 3.5.6 of the Rozenberg notes.
Conclusion
Today we have explored the physics of the Mott metal-insulator transition, a phenomenon where band theory fails spectacularly due to strong electron correlations. We have moved beyond the simple limits of the Hubbard model to understand the transition itself as a competition between kinetic energy and Coulomb repulsion.
Key Takeaways:
- Strong correlation splits a single electronic band into a Lower and Upper Hubbard Band, separated by the Mott gap .
- The Mott transition occurs as the ratio of interaction to bandwidth () is tuned, causing the Hubbard bands to overlap and close the gap.
- The transition is often first-order at finite temperature, ending in a critical point, much like a liquid-vapor transition. The phase diagram of V₂O₃ is a canonical example.
- Experimental signatures are crucial for identifying a Mott transition:
- A dramatic jump in resistivity.
- The opening of a gap and formation of Hubbard bands, observable via photoemission and optical spectroscopy.
- A quasiparticle peak near the Fermi level in the correlated metal, which narrows as the transition is approached.
- An enhancement of the effective mass () near the transition.
- A characteristic transfer of spectral weight in optical conductivity.
Preview of the Next Lesson
Throughout this lesson, we have referred to results from Dynamical Mean-Field Theory (DMFT). We've seen that it successfully describes the coexistence of coherent quasiparticles and incoherent Hubbard bands, and provides a theoretical framework that matches experiments on materials like V₂O₃. But what is DMFT? In our next lesson, we will open the black box and formulate the self-consistent loop of DMFT, understanding how it maps a complex lattice problem onto a solvable quantum impurity problem.