Recommended resources
The freely available resources this lesson will direct you to.
Hello! Welcome back.
In our previous lesson, we established the principle of hydrostatic equilibrium, which describes the balance between gravity and the pressure gradient force. This led us to a fundamental differential equation describing the vertical structure of the atmosphere:
This equation tells us that the fractional change in pressure with height depends on temperature. To find the actual pressure profile, , we need to solve this equation.
Today's lesson directly follows from this point. We will tackle the learning outcome: to derive the barometric formula to show how atmospheric pressure decreases exponentially with altitude in an isothermal atmosphere. To do this, we will make a simplifying assumption about the atmosphere's temperature structure, solve the differential equation, and analyze the result.
This is a classic problem in atmospheric physics, and the resulting formula provides the first quantitative approximation of the atmosphere's pressure profile.
1. The Isothermal Atmosphere Assumption
To integrate the equation , we need to know how temperature behaves as a function of altitude . The simplest possible assumption is that the temperature is constant.
An isothermal atmosphere is a model atmosphere where the temperature does not change with altitude ().
While we know from experience (e.g., climbing a mountain) that this is not strictly true for the real atmosphere, it serves as a powerful first approximation. By assuming is constant, along with our previous reasonable assumptions that and are also constant, the term becomes a single constant value. This transforms our problem into a simple, first-order ordinary differential equation that you'll likely find familiar from your previous studies in mathematics.
2. Deriving the Barometric Formula
With the isothermal assumption in place, we can now integrate the hydrostatic equation to find . The following resource provides a clear, step-by-step derivation. While it starts from the initial force balance, which we covered last lesson, it's useful to see the full logical flow from forces to the final exponential formula.
Derivation of the barometric formula (isothermal atmosphere)
This guide from tec-science.com walks through the complete derivation of the barometric formula. It begins by establishing the relationship between pressure and height changes in a small layer, incorporates the ideal gas law, and then performs the integration under the isothermal assumption.
Please read the following three sections: Start at 'Relationship between change in altitude and change in pressure at a given density'. This recaps the hydrostatic principle in discrete terms. Continue to 'Relationship between a change in altitude and a change in pressure at a given temperature', where the ideal gas law is substituted. Finish with 'Relationship between pressure and altitude change', which performs the crucial step of converting the relation into a differential equation and integrating it. Focus on the separation of variables and the application of integral calculus to arrive at the final formula.
Let's summarize the key mathematical steps of the integration you just reviewed:
-
Start with the differential form:
Here, we use for altitude, which is equivalent to in the reading. -
Integrate both sides: We integrate from a reference level (altitude , pressure ) to an arbitrary altitude where the pressure is . Since , , and are assumed constant, the term on the right can be moved outside the integral.
-
Evaluate the integrals: The integral of is , and the integral of is just .
-
Solve for : Using the logarithmic identity , we get:
Exponentiating both sides gives the Barometric Formula:
This equation shows that in an isothermal atmosphere, pressure decreases exponentially with height.
3. Scale Height
The barometric formula can be written in a more compact and intuitive form by introducing a new term called the scale height, usually denoted by .
The scale height is defined as:
Notice that has units of length (e.g., meters or kilometers). Substituting this into the barometric formula gives:
What does represent physically?
It is the characteristic vertical distance over which the atmospheric pressure decreases by a factor of (approximately 37%). If you move upward by one scale height, , the pressure drops to .
The following resource provides a concise derivation similar to the one above and introduces the scale height concept very clearly.
Hydrostatic Equilibrium and Exponential Atmospheres
This document from the University of Maryland, 'Hydrostatic Equilibrium and Exponential Atmospheres', presents a parallel derivation and explicitly defines the scale height, H. It also calculates a typical value for Earth's atmosphere.
Please read Section 2, 'Derivation of Pressure Profile: ideal gas, constant T, g'. Note the use of molecular mass m and Boltzmann's constant k instead of the specific gas constant R_s. The relationship is R_s = k/m. Focus on the definition of scale height H and the final form of the equation, P = P_0 e^{-r/H}.
For a typical Earth surface temperature of K, the scale height is about 8.8 km. This means that at an altitude of 8.8 km (roughly the height of Mount Everest), the atmospheric pressure is about times the pressure at sea level.
4. Visualizing the Result and Evaluating the Model
The exponential decay predicted by the barometric formula is a fundamental feature of our atmosphere. The graph below shows this relationship.
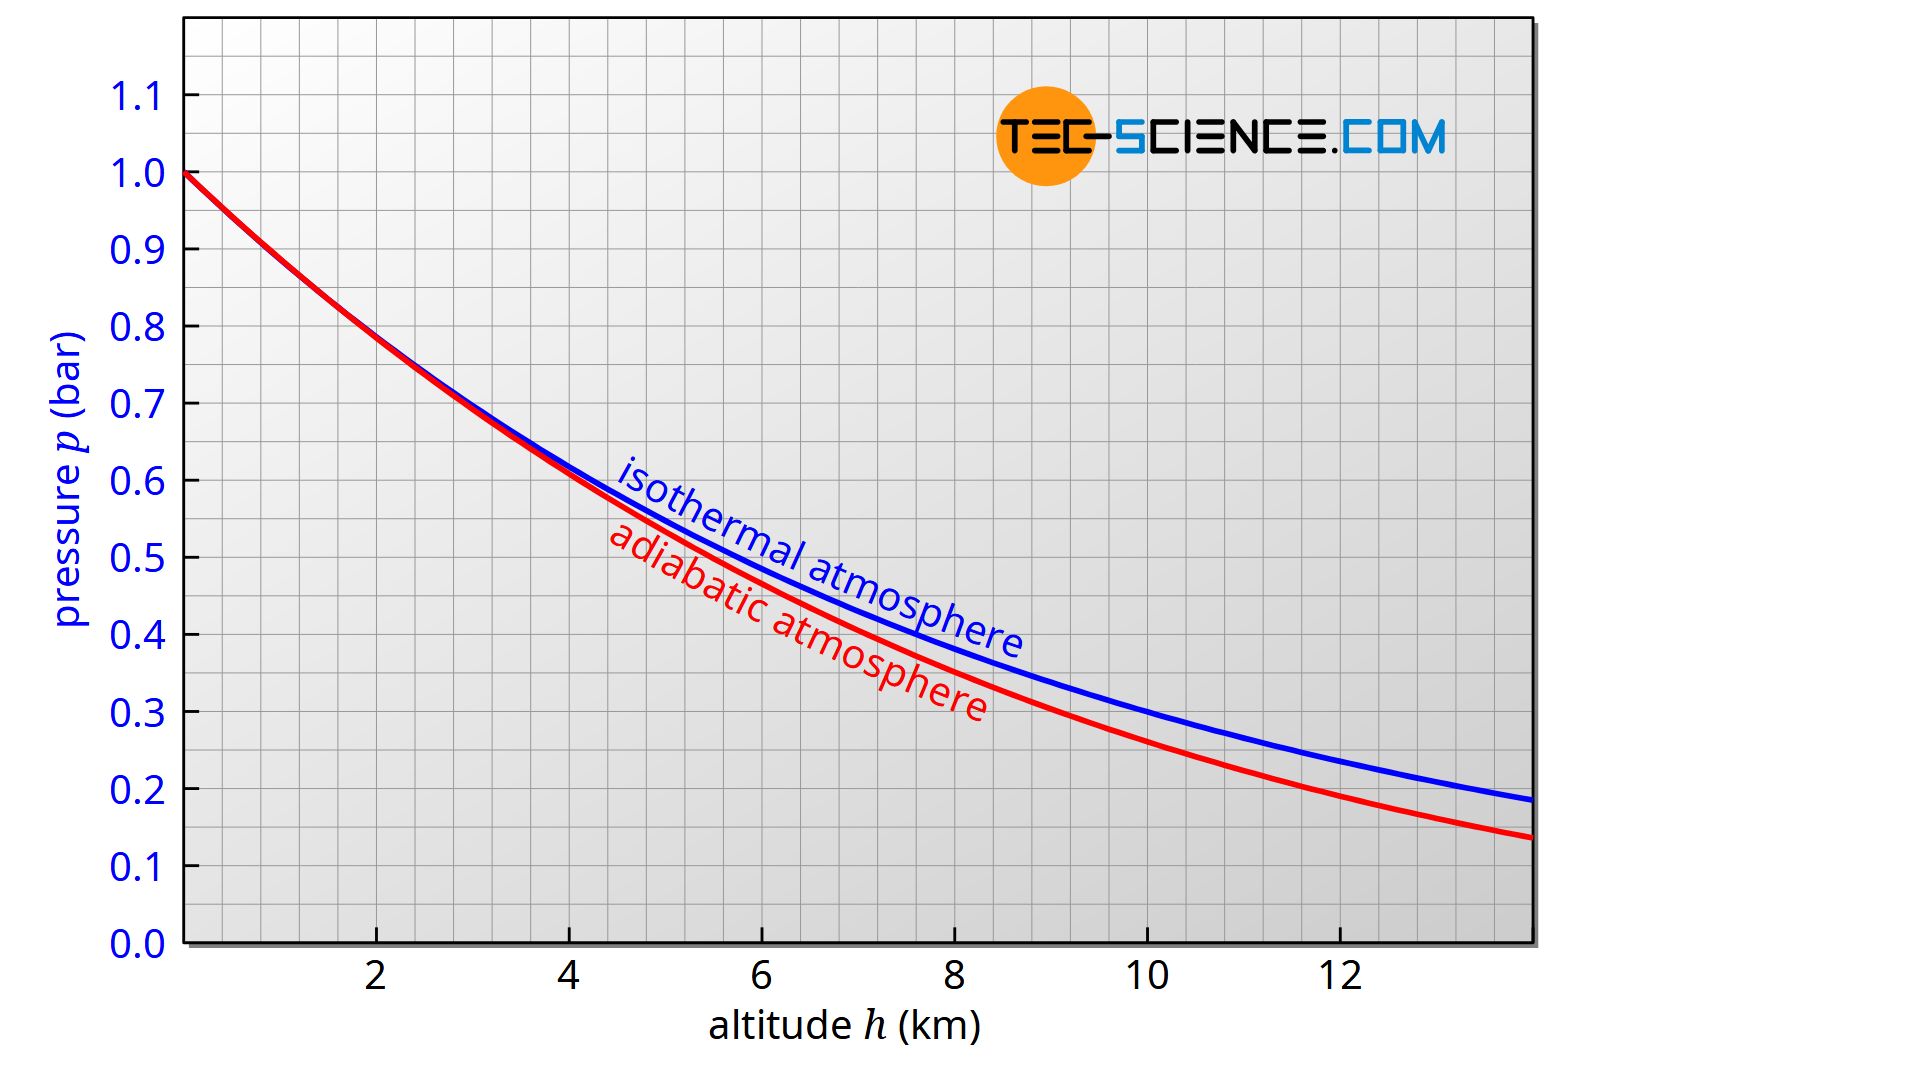
The blue curve is a plot of our result, . As you can see, the pressure drop is rapid at first and becomes more gradual at higher altitudes, which is characteristic of exponential decay.
However, our derivation rested on a major simplification: a constant temperature. How good is this assumption? For a model to be useful, we must understand its limitations.
Hydrostatic Equilibrium and Exponential Atmospheres
The same document we just looked at contains an excellent critical evaluation of the assumptions made in the derivation.
Please read the section that begins 'But now let’s revisit our assumptions for the atmosphere...'. This section thoughtfully discusses the validity of assuming an ideal gas, constant gravity, and, most importantly, constant temperature in the context of the real Earth's atmosphere.
As the reading explains, the isothermal assumption is a significant simplification. In the troposphere (the lowest ~10-15 km of the atmosphere), temperature actually decreases with height. This has a noticeable effect on the pressure profile, as shown by the difference between the blue (isothermal) and red (adiabatic) curves in the graph above. The pressure in a more realistic model of the troposphere drops faster with height than in the isothermal case.
Conclusion
In this lesson, we have built upon the concept of hydrostatic equilibrium to develop a quantitative model of the atmosphere's pressure structure.
Key Takeaways:
- By assuming a constant temperature (isothermal atmosphere), the hydrostatic balance equation can be solved.
- The solution is the barometric formula: , which shows that pressure decreases exponentially with altitude.
- The scale height, , is the characteristic altitude increase over which pressure drops by a factor of . For Earth, is approximately 8-9 km.
- The isothermal model provides a good first approximation but deviates from reality because the actual atmospheric temperature is not constant with height.
Preview of the Next Lesson:
We have now seen the consequences of assuming a constant temperature. The next logical step is to relax this assumption and build a more realistic model. In the next lesson, we will use the first law of thermodynamics in conjunction with the hydrostatic equation to derive the dry adiabatic lapse rate, which describes how the temperature of a rising parcel of dry air changes with altitude. This will explain the physics behind the red curve in the graph and give us a more accurate picture of the atmosphere's thermal structure.