Recommended resources
The freely available resources this lesson will direct you to.
- How To Set Systems Instead Of Goals (a system that will change your life)www.youtube.com
- Key Performance Indicators (KPIs) with exampleswww.youtube.com
- Tracking Progress: Tools and Techniques for Goal Achievement ...medium.com
- Building the bridge to trust in skills assessment | CFA Institutewww.cfainstitute.org
Hello! Welcome to the final lesson in our module on designing your personal learning system.
In our last lesson, we focused on defining what learning effectiveness means to you. We used frameworks like OKRs and UX KPIs to categorize potential indicators into behavioral (process), attitudinal (feeling), and outcome (results). You now have a menu of options for what you could measure.
Today, we'll move from that menu to a concrete plan. The learning outcome for this lesson is to select 1-2 key indicators to measure your learning progress and design a simple tracking system. This is where you build your personal "learning dashboard"—a tool that will make your progress visible, help you diagnose issues, and keep you motivated. This system will be the core feedback loop for debugging your learning process, directly addressing your goals of improving consistency and application.
1. From a Menu to a Mission: Selecting Your Key Indicators
In UX design, a dashboard cluttered with dozens of metrics is often less useful than one with a few carefully chosen Key Performance Indicators (KPIs). The same principle applies to your personal learning system. Tracking too much can lead to "measurement fatigue," where the act of tracking becomes a chore that distracts from the learning itself. Our goal is to select the vital few metrics that give you the most insight with the least effort.

To make this selection, it's crucial to understand the difference between two types of indicators.
Leading vs. Lagging Indicators
This distinction is fundamental to effective tracking.
- Lagging Indicators measure the output or result. They tell you if you've achieved your goal (e.g., test scores, time to complete a project). They are easy to measure but hard to influence directly.
- Leading Indicators measure the input or process that drives the result. They are predictive of future success (e.g., hours of focused study, number of practice problems completed). You have direct control over these.
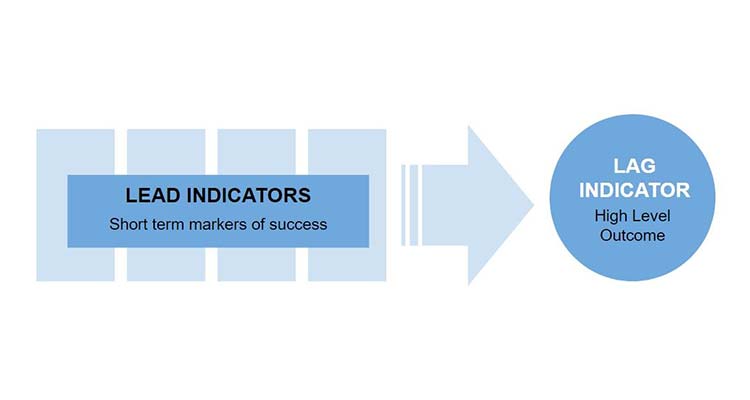
An effective tracking system monitors both. You need a lagging indicator to know if you're reaching your destination and a leading indicator to ensure you're driving the car correctly day-to-day.
Tracking Progress: Tools and Techniques for Goal Achievement ...
The article 'Tracking Progress: Tools and Techniques' provides an excellent explanation of this concept and other essentials for effective tracking.
Please read the section 'Essential Elements of Effective Progress Tracking', paying close attention to the definitions and examples of 'Leading vs. Lagging Indicators'. Also, read the first point under 'Common Tracking Mistakes and Solutions' titled 'Over-Tracking and Measurement Fatigue' to understand the importance of simplicity.
The idea of focusing on the process (leading indicators) is so powerful because it shifts your attention from a distant, sometimes intimidating, goal to the small, daily actions you can control.
How To Set Systems Instead Of Goals (a system that will change your life)
The video 'How To Set Systems Instead Of Goals' reinforces this idea perfectly. It explains why focusing on and tracking your system is more effective than obsessing over goals.
Watch from 04:14 to 05:41. Notice the key distinction: 'Goals are for setting Direction, but systems are for making progress.' Pay attention to the advice to 'track your system, not your goals.'
Your "Polaris" KPI
To bring even more focus, we can borrow another concept from the business world: the "Polaris" or "North Star" KPI. This is the single most important metric you are trying to optimize at a given time. While you might track a few indicators, your Polaris KPI is the one that guides your main effort.
Key Performance Indicators (KPIs) with examples
In this video on KPIs, the presenter explains the concept of a 'Polaris KPI' and why it's so powerful for focusing your efforts.
Watch from 10:21 to 12:46 to understand the benefit of selecting just a few KPIs, and then from 15:05 to 18:25 to learn about the 'Polaris KPI' and how it serves as your guiding metric.
For a learning project, your Polaris KPI might be a leading indicator (like "consistency of practice") when you're building a habit, or a lagging indicator (like "application speed") when you're focused on fluency.
Test your understanding!
Imagine your learning Objective is: "Learn CSS Grid to build responsive layouts for web projects."
Select one leading indicator and one lagging indicator you could track. Then, decide which one would be your Polaris KPI for the first month and explain why.
Show answer
- Leading Indicator: Number of layouts built using CSS Grid per week (Target: 2).
- Lagging Indicator: Time taken to convert a static design mockup into a fully responsive CSS Grid layout.
Polaris KPI for the first month: The leading indicator (number of layouts built).
Justification: In the initial phase of learning, the most important thing is consistent practice and volume to build familiarity and reps. Focusing on the process of building layouts ensures you are putting in the work that will eventually improve the outcome (speed). After a month, you might shift the Polaris KPI to the lagging indicator to focus on improving efficiency.
2. How to Measure: Designing Your Tracking System
Now that you've chosen what to measure, let's design how you'll track it. Your system should be simple, easy to maintain, and provide clear insights.
Choosing Your Tool
You have several options, from digital to analog. The best tool is the one you'll use consistently. Given your background, a digital tool like a spreadsheet might be a natural fit, but a physical journal can be surprisingly effective.
Tracking Progress: Tools and Techniques for Goal Achievement ...
The 'Tracking Progress' article we looked at earlier also provides a great overview of different tools you can use.
Skim the sections 'Digital Tools for Progress Tracking' and 'Analog and Physical Tracking Methods'. You don't need to read every detail, but get a sense of the options available, from spreadsheets and apps to bullet journals and wall calendars.
A simple spreadsheet (like Google Sheets or Excel) is often the most flexible and powerful starting point. Here is a basic template structure you could use for weekly tracking:
| Week # | End Date | Leading Indicator: [Name of Metric] | Lagging Indicator: [Name of Metric] | Weekly Reflection & Actions |
|---|---|---|---|---|
| 1 | 05/Oct | 3/4 | Confidence Score: 2/5 | Feeling overwhelmed. Action: Break down problems more. |
| 2 | 12/Oct | 4/4 | Confidence Score: 3/5 | Consistency helped! Action: Continue with 4 sessions. |
| 3 | 19/Oct | 4/4 | Confidence Score: 3/5 | Plateauing. Action: Find a harder project. |
The "Weekly Reflection & Actions" column is critical. This is where you analyze the data and decide what to do next. This creates a feedback loop, turning tracking from a passive activity into an active tool for improvement.
3. Building Confidence in Your System with Evidence-Centered Design
How can you be sure that the indicators you've chosen truly measure the skill you're trying to build? For this, we can turn to a powerful framework from the world of learning science: Evidence-Centered Design (ECD).
Think of it like this: if you're building a bridge, you need a blueprint. ECD is the blueprint for a trustworthy assessment or, in our case, a trustworthy tracking system.
Building the bridge to trust in skills assessment
This article from the CFA Institute uses a fantastic bridge-building analogy to explain why a clear design framework is essential for measuring skills effectively.
Read the introduction with the bridge analogy and the section 'The blueprint: evidence-centered design'. Focus on how ECD connects three things: the claims you want to make, the evidence that supports them, and the tasks that produce that evidence.
Let's map your learning system to the ECD framework:
- Claim: This is the skill you claim to have learned. (e.g., "I can build responsive layouts with CSS Grid.")
- Evidence: This is your lagging indicator—the proof that your claim is true. (e.g., "I can convert a mockup to a responsive layout in under 2 hours.")
- Task: These are the learning activities that produce the evidence, measured by your leading indicators. (e.g., "Building two layouts per week.")
By structuring your tracking system this way, you create a logical, defensible link between your daily practice and your ultimate goal. It gives you confidence that you're not just busy, but busy working on the right things. Your weekly review process is then your "inspection and maintenance" routine for the bridge you're building.
Conclusion
Today, you've moved from theory to practice by designing the engine of your personal learning system. A well-designed tracking system is not about creating bureaucracy; it's about creating clarity. It provides the feedback necessary to iterate and improve—a process you know well from your design work.
Key Takeaways:
- Select a vital few (1-2) key indicators to avoid measurement fatigue.
- Balance leading indicators (the process you control) with lagging indicators (the results you desire).
- Use a "Polaris KPI" to maintain focus on the single most important metric for your current stage of learning.
- Design a simple tracking system (like a spreadsheet or journal) with a built-in weekly review loop to turn data into action.
- Frameworks like Evidence-Centered Design provide a solid foundation, ensuring your metrics are meaningfully connected to your learning goals.
What's Next?
This lesson concludes the "design" phase of our course. You now have a complete, personalized learning system on paper. The final module is the Capstone, where you'll put it all into action.
In the first lesson of the capstone module, you will document your current process for learning a new concept. This will create a "before" snapshot, a baseline against which you can measure your improvement. The tracking system you've designed today will be the primary tool you use to analyze your process and demonstrate your growth throughout the capstone project. Let's get ready to build