Recommended resources
The freely available resources this lesson will direct you to.
Hello. Last time, you separated corporate, business, product, and design strategy: different scopes of choice, from where a company competes to how a customer experiences a product benefit. This lesson asks what must be true for those choices to work together as a business.
You’ll diagram how a company creates value for customers, delivers that value, and captures enough value to sustain the operation. We’ll use a budget airline as a concrete case, then extract a method you can reuse for a venture idea or in a leadership workshop. Allow about 40 minutes, including the short video and reading.
A business model connects the promise to the operation
A product strategy might say, “Serve price-conscious travelers who want an affordable flight.” That identifies a customer and a benefit, but leaves crucial questions unanswered. How will those travelers find and book the flight? What must the airline do reliably to offer it? What will customers pay for, and what will it cost the airline to provide?
A business model brings those answers into one view. It describes how an organization creates, delivers, and captures value. Value created is not the same as revenue captured: a traveler may benefit greatly from a low fare while the airline still loses money providing it. Equally, a company might collect a fee yet fail to provide a benefit customers will continue to choose.
Watch Strategyzer’s Ep 2 - Visualizing Your Business Model for a compact introduction to the nine-block Business Model Canvas and its budget-airline example.
Ep 2 - Visualizing Your Business Model
Strategyzer’s “Ep 2 - Visualizing Your Business Model” names the nine parts of a business model, then shows how a budget airline’s choices reinforce one another.
Watch the nine blocks for the vocabulary. Continue with the airline case. Notice that a low ticket price depends on choices about booking, customer interaction, aircraft, airports, and optional purchases—not just a decision to charge less.
The video’s strongest point is that the blocks are interdependent. A promise of low fares would be difficult to maintain if the airline retained every costly convention of a full-service carrier. Conversely, a lean operation would mean little if it made the offer unattractive to the intended travelers.
Read the canvas as three questions
The Business Model Canvas gives you nine places to make a business’s logic visible. The template below shows their familiar layout. Its position on the page helps discussion, but the important work is explaining the connections between blocks.
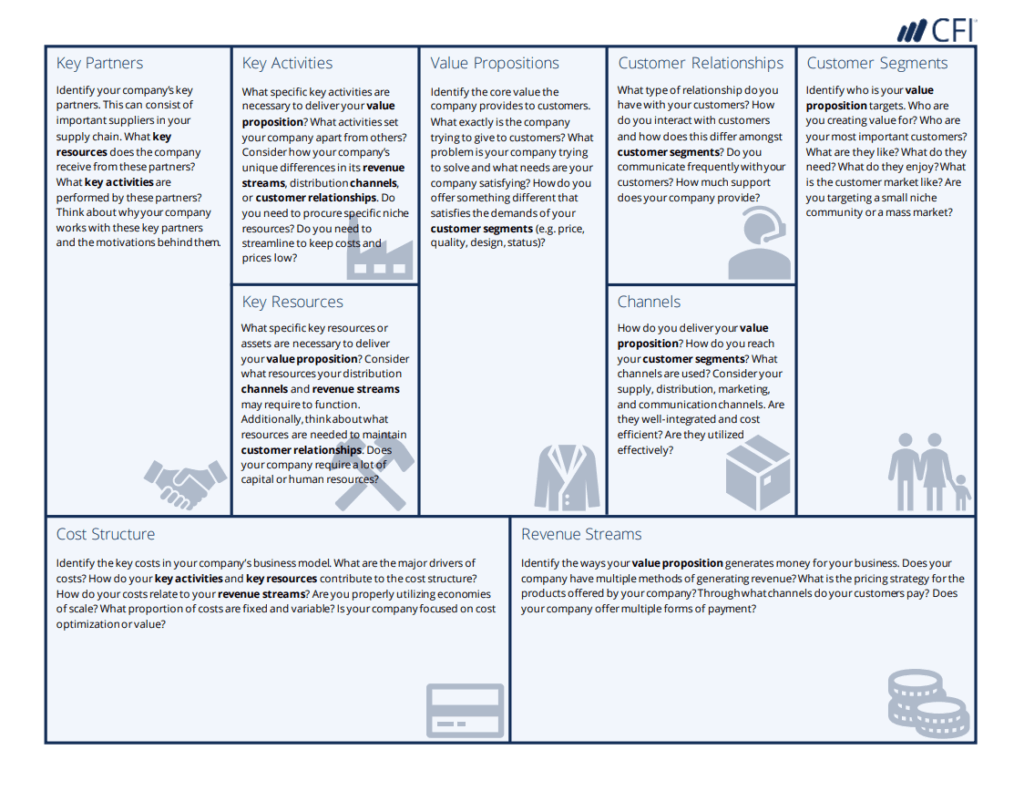
Strategyzer’s explanation is worth reading alongside the template. It supplies precise meanings for the blocks, particularly the distinction between a channel (how customers encounter, buy, or receive an offer) and a customer relationship (how the company acquires, supports, and retains them).
Business models: the toolkit to design a disruptive company
Read Strategyzer’s “Business models: the toolkit to design a disruptive company” to put working definitions behind the visual canvas.
In “What is a business model?”, read the core definition, beginning with the question about asking five people and ending just after the quoted definition. Then, in “The 9 building blocks of The Business Model Canvas,” read the block descriptions, from “Think of your business model as a blueprint” through the end of “Key Partnerships,” stopping before the paragraph beginning “Embracing innovation.” Follow the subsections “Desirability: Do customers want it?” (Customer Segments, Value Propositions, Channels, Customer Relationships), “Viability: What is it worth?” (Revenue Streams, Cost Structure), and “Feasibility: Can we deliver it?” (Key Resources, Key Activities, Key Partnerships). As you read, ask what evidence would be needed to fill each block for an actual company.
A useful way to interpret the nine blocks is through three questions:
- Create: For which customer segments does the value proposition solve a worthwhile problem?
- Deliver: Through which channels and customer relationships does the offer reach people, and which resources, activities, and partners make that possible?
- Capture: Which revenue streams bring money in, and what cost structure must the model support?
These are lenses, not sealed compartments. Key activities help create the benefit as well as deliver it; a channel can improve the customer experience while adding cost. “Capture” also requires looking at costs—not merely pointing to a payment button.
A filled diagram: the budget airline
Let’s turn the video’s airline example into a compact value-system diagram. This represents an illustrative budget-carrier model, not a claim that every airline uses exactly these arrangements. Each entry answers one canvas block; read across rows and between columns to see whether the choices fit.
| Value for customers: create | System for reaching and serving them: deliver | Economics: capture |
|---|---|---|
| Customer segments: Travelers who put a high priority on affordable flights and will accept fewer included services. | Channels: Web and telephone booking, with a strong emphasis on direct purchase. | Revenue streams: Base fares and optional purchases such as baggage, food, or priority boarding. |
| Value proposition: A flight at a low base price, with some extras available separately. | Customer relationships: Largely standardized, automated interactions rather than extensive personal service. | Cost structure: Aircraft operation, maintenance, training, airports, and booking and service operations; the model seeks to keep several of these costs low. |
| Key resources: An aircraft fleet organized around a single aircraft type, plus the systems needed to sell and operate flights. | ||
| Key activities: Operating flights and turning aircraft around quickly enough to make productive use of the fleet. | ||
| Key partners: Airports and external travel-service providers, among others. |
The diagram is more than nine descriptions. It makes several dependencies open to inspection. Offering a low base fare depends in part on keeping operating costs in line with that promise. Using one aircraft type can simplify training and maintenance; rapid turnarounds can increase the time aircraft spend in service. Direct booking and standardized interactions can support a lower-cost operation, although they may ask customers to do more for themselves. Optional purchases let customers choose extras while giving the airline additional potential revenue.
None of those relationships proves that the business is profitable. The canvas states a logic to examine. For instance, separating baggage from the base fare may suit a traveler carrying only a small bag, but surprise charges could undermine another traveler’s perception of value. A design-led leader should therefore examine both sides of the same choice: does the booking experience make the affordable offer understandable to customers, and does it support the economics the airline relies on?
Notice, too, what we have not assumed. The video mentions partnerships with travel-service providers, but the diagram does not invent a commission rate or treat partner income as an established revenue stream. A diagram should distinguish what is known from what is merely plausible.
Make the links legible, not just the boxes full
In a workshop, nine well-filled boxes can still conceal a weak business. The test is whether someone can explain a few important links in ordinary language. For the airline, one such explanation is:
Price-conscious travelers value a low base fare. Direct booking and a standardized service model help the airline offer it; separate charges for selected extras provide additional revenue. The model remains credible only if travelers understand what the base fare includes and the operating costs remain supportable.
That statement ties a customer benefit to a delivery arrangement and an economic condition. It also exposes a design decision worth discussing: how prominently should the booking flow explain optional charges? Hiding them might produce more completed initial selections, yet weaken trust when customers see the final price. Improving the interface is therefore not merely polishing a screen; it may protect a link on which the business model depends.
When diagramming another company—or a venture that does not yet exist—use this order of inquiry:
- Set the boundary. Name the particular offering and customer group. A company with several businesses may need several diagrams.
- State the customer benefit. Describe the problem solved or outcome gained, not just the product’s features.
- Show access and provision. Include both the customer-facing route to purchase and the less visible capabilities that make delivery possible.
- Show the exchange. Identify who pays, what they pay for, and the major costs of providing the offer. The user and the payer may be different people or organizations.
- Mark uncertain links. Label an unverified entry as an assumption rather than presenting a tidy canvas as evidence.
That last point matters especially for a new venture. A proposed channel is not yet a working distribution system; an intended price is not yet proof that customers will pay. The canvas gives founders and executives a shared picture of what needs to be true, while leaving room for evidence to revise it.
Conclusion
A business model diagram should show who receives a benefit, what makes that benefit available, and how the organization can earn enough to keep providing it. The nine canvas blocks make the components visible; the explanations between them reveal whether the model holds together. For a design leader, this is a way to locate experience decisions within the whole business rather than discuss them in isolation.
Next, you’ll look more closely at a company’s revenue, cost, and risk drivers. Today’s diagram identifies where to look; that lesson will help you judge which parts of the model matter most to its performance.