Recommended resources
The freely available resources this lesson will direct you to.
- Stable Oxygen Isotopes & Paleoclimate Proxies | GEO GIRLwww.youtube.com
- Big Insight from Little Things: An Introduction to Isotope Analysis in Climate Sciencewww.youtube.com
- What do ice cores reveal about the past? | National Snow and Ice Data Centernsidc.org
- Geochemistry of Ice Cores: Stable Isotopes, Gases, and ...courses.washington.edu
Hello. In the last lesson, instruments observed glacier height, surface balance or regional gravity, and each observation needed a physical interpretation before it became an estimate of mass change. An ice core presents the same kind of problem across a much longer timescale. It preserves snow that fell in the past, but it does not contain a thermometer reading for the day that snow formed.
This lesson follows one measurable feature of that snow—the ratio of oxygen isotopes—through evaporation, atmospheric transport and snowfall. By the end, you should be able to explain why oxygen isotope ratios in polar ice often track local temperature, what a reported value means, and why the relationship is informative without being a universal conversion formula.
How water acquires an isotope signature
Most oxygen atoms have eight protons and eight neutrons; these are oxygen-16. Oxygen-18 has the same number of protons but two additional neutrons. Both isotopes can become part of a water molecule. Their chemistry is similar, but their different masses give the resulting water molecules slightly different behaviour during changes of phase. That small difference is called isotopic fractionation.
Start with water evaporating from the ocean. Water containing oxygen-16 enters the vapour phase a little more readily than water containing oxygen-18. The vapour is therefore relatively depleted in oxygen-18 compared with the ocean water from which it came. Later, when some of that vapour condenses, water containing oxygen-18 is somewhat more likely to enter the liquid or ice phase. The condensate is consequently enriched in oxygen-18 relative to the vapour present at that moment.
The National Snow and Ice Data Center’s short explanation introduces the isotope contrast and its use in ice cores. Read it for the physical sequence; we will then make an important distinction about what “enriched” means.
What do ice cores reveal about the past? | National Snow and Ice Data Center
Read the National Snow and Ice Data Center’s explanation for a first account of how an isotope ratio in snow can carry information about temperature.
Under “Measuring past temperatures with an oxygen thermometer,” read the explanation, beginning with the different oxygen isotopes and ending with the interpretation of polar ice cores. Look at the schematic and its caption immediately below. Focus on the relative preferences during evaporation and condensation: neither process separates the isotopes completely.
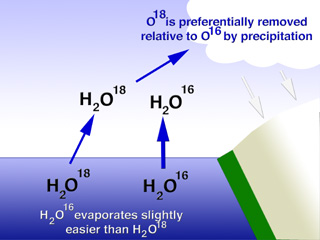
The picture can seem to pose a puzzle. If condensation favours oxygen-18, why would cold-region snow contain less oxygen-18? The answer lies in what happens to the remaining vapour after each bout of precipitation. A snowflake can be enriched relative to the vapour that produced it while still being depleted relative to snow that fell earlier along the air mass’s route.
What the laboratory reports:
A laboratory compares the abundance of oxygen-18 with oxygen-16 in a sample. Write that ratio as
where denotes the number of atoms of each isotope. Because changes in are small, results are usually expressed relative to a reference water using delta notation:
The result is stated in per mille—parts per thousand—rather than percent. For example, if a sample has , its is per mille. A value of per mille represents a higher oxygen-18-to-oxygen-16 ratio than per mille does. “More negative” thus means “more depleted in oxygen-18 relative to the reference,” not that oxygen-18 has disappeared.
The following lecture slides give both the delta definition and a concise account of fractionation. They use SMOW (standard mean ocean water) as the reference in their displayed equation.
Geochemistry of Ice Cores: Stable Isotopes, Gases, and ...
Read the ice-core lecture slides for the isotope-ratio convention and the distinction between evaporation and condensation.
Find the slides labelled “Oxygen isotopes in ice cores” and “What is fractionation?” On the former, read the isotope definition and delta equation. Then, on “What is fractionation?”, read the phase-change explanation. In particular, note that the slides compare each newly condensed portion of water with its contemporaneous vapour, not necessarily with the ocean or with earlier snowfall.
Delta notation tells us what was measured. It does not, by itself, tell us the temperature. That interpretation depends on how the snow’s isotope ratio was produced.
Why progressively colder snowfall tends to be isotopically lighter
Imagine an air mass carrying ocean-derived moisture toward a cold ice-sheet interior. As it cools, some vapour condenses and falls out as rain or snow. Condensation preferentially removes oxygen-18 from the vapour. If the precipitation leaves the air mass, the vapour that continues onward has a lower oxygen-18-to-oxygen-16 ratio than it had before.
As cooling and precipitation continue, later snowfall forms from progressively depleted vapour. In broad terms, a colder destination has often been reached after more cooling and progressive rainout. Its snowfall tends to have a more negative . The preferential removal of one isotope through repeated condensation is commonly described as Rayleigh distillation.
This resolves the earlier puzzle. Each precipitation event favours oxygen-18 compared with the vapour it condenses from. But after earlier precipitation has carried heavy isotopes away, a later snowfall event can be poorer in oxygen-18 compared with earlier snowfall. The two comparisons have different baselines, so both statements can be true.
Read the lecture slides’ idealized account of that process and inspect their example temperature relationship.
Geochemistry of Ice Cores: Stable Isotopes, Gases, and ...
Return to the lecture slides to connect progressive rainout with an observed isotope–temperature relationship.
Find “Rayleigh Distillation.” Read its starting conditions and five assumptions. Then inspect the neighbouring graph labelled “δ18O vs air temperature” and its fitted line. Finally, by the plot comparing satellite temperatures with shallow-core estimates, read the comparison note. Treat the assumptions and fitted line as parts of an illustrative model and dataset, not as a universal law for all ice cores.
The slides show a fitted relationship of the form for the dataset displayed. Its positive slope captures the central observation: in that setting, warmer conditions correspond to less negative isotope values. But the fitted coefficients cannot simply be applied to any depth of any core. Doing so would assume that the source water, route of the air mass, season of snowfall and isotope response to temperature all stayed comparable.
From snowfall to a record of local climate
Snow retains much of its isotope composition when it accumulates and becomes buried ice. By sampling successive layers of a core, researchers obtain an isotope record extending into the past. In polar ice, is principally a proxy for the conditions under which local snowfall formed, especially temperature. It is not a direct measurement of the global mean temperature.
A useful way to state the inference is conditional: if the moisture source and atmospheric route are sufficiently comparable, a shift toward more negative generally indicates colder conditions associated with snowfall at the site. The physical fractionation supplies a reason for the direction of this relationship. Observations and comparisons with other climate evidence are still needed to assess its magnitude.
Several influences can change an ice core’s isotope ratio without the same change in local annual-mean temperature:
- Moisture source and transport: Different ocean source regions or routes can give incoming vapour different initial ratios and different histories of rainout.
- Season of snowfall: A core preserves the snow that fell and survived. If the proportion falling in winter changes, its isotope signal may shift even if the annual mean temperature changes less.
- Elevation and changing geography: Snowfall temperature and transport can change if an ice sheet’s surface height or the regional circulation changes.
- Ocean composition: Large ice sheets preferentially store water depleted in oxygen-18. When ice sheets grow, the ocean left behind becomes relatively enriched, changing the starting composition of evaporated moisture.
- Preservation in the core: Mixing or alteration of snow after deposition can soften fine-scale isotope variations, even if broader patterns remain interpretable.
These are not reasons to disregard the proxy. They specify what must be checked before translating an isotope change into degrees of temperature change. They also explain why the same measured shift could have different temperature interpretations at different sites or periods. One further distinction is worth keeping clear: oxygen isotopes in marine shells involve seawater composition and shell formation, so they cannot be read using the polar-snow interpretation alone.
Conclusion
The physical chain behind an ice-core oxygen proxy is now in place. Oxygen-16 and oxygen-18 fractionate slightly during evaporation and condensation. Repeated precipitation removes proportionally more oxygen-18 from a cooling air mass, so snow formed farther along that cooling history often has a more negative . Buried snowfall preserves a measurable record that can therefore inform estimates of past local temperature.
The qualification is as important as the mechanism: the isotope ratio is observed; temperature is inferred. In the next lesson, you will examine that inferential step more closely—particularly how proxy relationships are calibrated, what happens if they change over time, and how reconstruction uncertainty should be quantified.