Recommended resources
The freely available resources this lesson will direct you to.
Hello! In the last lesson, you set a testable rule for identifying fulfillment locations with persistently high late-delivery rates. That rule is useful only if everyone agrees on what data and decisions it covers—and what could make its conclusion unreliable.
This final lesson in the decision-focused analytics module turns that work into a short analytics request brief. You will document four things: scope (what you will do), assumptions (what you are relying on), risks (what might go wrong), and limitations (what the result cannot establish). This is a practical skill for both analytics and data science work: a clear brief prevents a technically correct answer from being used for the wrong decision.
Start the documentation before the analysis
Imagine that the stakeholder asks, “Can you tell us which fulfillment locations need attention?” You already have a sharper question: across the last eight completed weeks, which sufficiently busy locations met the agreed rule for a persistent late-delivery gap? The brief preserves that sharper interpretation so the request does not quietly expand into diagnosing causes, designing an intervention, or promising an improvement.
Watch this short excerpt from How to Document your Data Analytics Project by Tina Okonkwo. Its useful distinction is between documentation for the person making a decision and documentation for someone reproducing the work.
How to Document your Data Analytics Project
Watch How to Document your Data Analytics Project for guidance on when to start documenting and what a project record should contain.
Watch audience and timing, beginning with the discussion of technical and non-technical readers. Continue through project components, where the speaker moves from the problem statement to dataset constraints, assumptions, and methodology. As you watch, distinguish what should be agreed before analysis from what can only be reported afterward.
For a stakeholder-facing brief, put the decision and boundaries first. Keep implementation details—such as SQL joins or timestamp parsing rules—in a linked technical specification when they need more space. Documentation should begin with the request, then be updated when data checks reveal new issues or the agreed scope changes.
Scope: draw a boundary around the answer
A scope statement is more precise than “analyze late deliveries.” It identifies the decision, population, period, output, exclusions, and constraints. The AQuA Book treats the initial specification as a shared agreement between the person requesting an analysis and the analyst, rather than a private set of analyst notes.
Read the AQuA Book's guidance on agreeing an analytical request before designing the work.
In Chapter 6, “Engagement and scoping,” begin at the opening paragraph, shared understanding. Then read subsections 6.1.1, “The commissioner’s responsibilities,” and 6.1.2, “The analyst’s responsibilities,” ending at specification sign-off. Focus on what must be clarified jointly: boundaries, constraints, uncertainty, and the intended output.
Here is how that agreement could look for the running example:
Decision supported: Which locations should receive a follow-up investigation into late two-day deliveries?
In scope: Genuine, dispatched two-day orders due in the last eight completed reporting weeks; weekly location and service-wide late-delivery rates; eligible order counts; application of the previously agreed minimum-volume and persistent-gap rule.
Deliverable: A location-by-week summary with flagged locations, volumes, data-quality checks, and a short explanation of what a flag means.
Out of scope: Establishing why a location has a gap, estimating the effect of a dispatch change, and building an ongoing operational dashboard.
The exclusions matter. A location flag supports a decision to investigate, not a decision that a particular process caused the gap. Likewise, an eight-week report is not automatically a maintained Power BI product. If the stakeholder needs weekly refreshes, that is an additional requirement with its own data, ownership, and validation implications.
Capture constraints that could change the answer: the agreed reporting time zone and week boundary, the data-as-of time, access to delivery events, the deadline for the decision, and who can confirm the meaning of the source fields. The request should name the owner of the decision, not just the person who asked for a table.
The Data Science Project Checklist offers a useful check against scope creep: write down what the work should not do as deliberately as what it should do.
The Data Science Project Checklist - Data Science PM
Read the checklist from Data Science PM to connect the underlying problem, explicit exclusions, and assumptions.
Under “1. Define a Clear Problem or Opportunity,” read “Define the Problem” and “Set the Goals,” starting with problem and anti-goals. Then find “List the Assumptions and Hypothesizes” and read assumptions versus hypotheses. Notice that an assumption supporting the work is not the same as the pattern the work sets out to test.
Assumptions: record what the answer depends on
An assumption is a proposition you are relying on but have not established through the current analysis. It is not a harmless footnote. If it fails, the meaning or feasibility of the result may change.
For example, the location analysis may rely on these propositions:
- The recorded delivery event denotes full delivery, not merely an attempted delivery or an initial parcel scan.
- The location field identifies the location responsible for the order under the agreed attribution rule.
- The available event feed is current enough, at the chosen data-as-of time, to classify orders due in the final reporting week.
Do not write “timestamps are accurate” and move on. A useful entry states why the assumption matters, who can verify it, when it must be checked, and what happens if it is false. For the first assumption, the response might be: “Confirm event meanings with the data owner before calculating rates; if full delivery cannot be distinguished from an attempted delivery, pause the late-rate comparison and revise the data requirement.”
The hypothesis from the last lesson is different: at least one sufficiently busy location meets the specified six-of-eight-week gap rule. That is what the analysis is meant to assess. Treating it as an assumption would prejudge the result.
The AQuA Book distinguishes a specification from an assumptions log. Its log is more formal than a short project brief needs to be, but its questions—what was assumed, why, by whom, and with what effect—scale down well.
Read the definitions that separate the agreed request from the record of assumptions.
In the book’s “Documentation” definitions, read from “Specification documentation” through “Assumptions log”: specification and assumptions. Pay particular attention to recording an assumption’s reliability and potential effect, rather than merely listing it.
An assumption that can be checked should be checked—especially if the decision would change when it fails. If it cannot be verified by the deadline, say so in the brief and agree whether the remaining uncertainty is acceptable.
Risks, issues, dependencies, and limitations are not interchangeable
These terms answer different questions:
| Term | Question it answers | Delivery-analysis example |
|---|---|---|
| Risk | What might happen and undermine the work or its use? | A late event-feed update might leave final-week statuses unresolved. |
| Issue | What is already wrong and needs a response? | A source extract already lacks location IDs for some orders. |
| Dependency | What must another person, system, or event provide? | The data owner must confirm the delivery-event definition. |
| Limitation | Even if the analysis is completed correctly, what can it not tell us? | Historical location gaps cannot establish the effect of a proposed dispatch alert. |
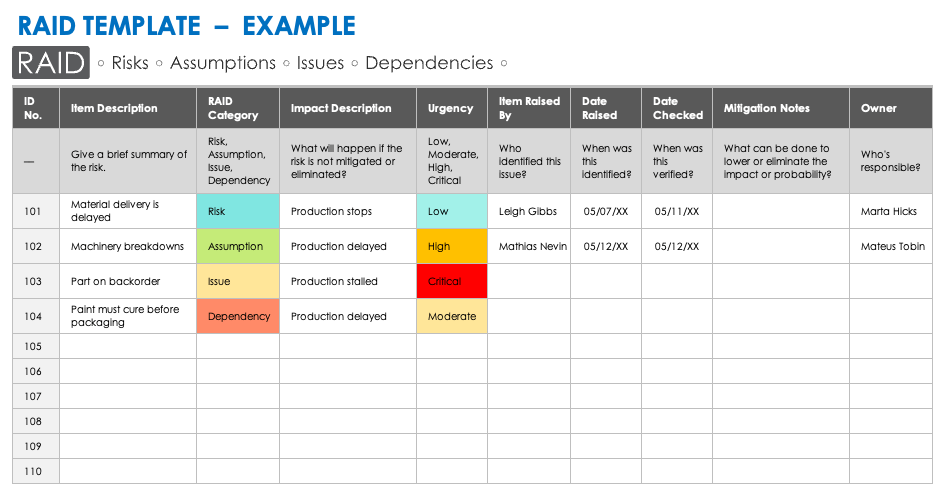
A RAID register—Risks, Assumptions, Issues, Dependencies—can keep the first three distinctions visible alongside assumptions. The example template below shows fields for impact, urgency, mitigation notes, and ownership. Its sample entries illustrate the format; classify items according to their actual status in your request, rather than treating a template’s categories as automatic.
A risk entry becomes actionable when it names a possible event, its consequence, a response, an owner, and a trigger for escalation. For instance:
Risk: The final week’s delivery events may arrive after the planned data extraction. Consequence: Some due orders cannot be classified in time for the location comparison. Response: Check feed currency and unresolved-status counts before applying the flagging rule. Owner: Analysis lead, with the data owner. Trigger: If the previously agreed 99% resolvable-status threshold is not met, mark the affected conclusion inconclusive and agree on a later as-of time or a narrower reporting window.
That is more useful than “data quality—high risk.” It links a foreseeable problem to a decision about whether the result may be used. The 99% threshold is a readiness gate from the prior lesson, not permission to treat the remaining unknown statuses as on-time. If even a small unresolved group could change whether a location meets the gap rule, disclose that uncertainty and resolve or qualify the comparison.
Read the checklist’s risk section for a broader view of what could undermine an analytical project beyond the calculation itself.
The Data Science Project Checklist - Data Science PM
Return to the checklist for its treatment of data, feasibility, and ethical risks.
Find “Assess Risks” near the end of the checklist. Read from the paragraph introducing risks specific to data science, beginning risk categories, through the list of categories that ends with technical availability. Focus on its instruction to qualify likelihood and impact and to plan mitigation for material risks. For the delivery request, consider risks to the interpretation of the output as well as to its production.
A limitation has a different job. It tells a future reader how far the completed result can travel. Some limitations are inherent in the design: eight completed weeks do not characterize every season; the minimum-volume rule leaves smaller locations unassessed by that screen; an observational comparison does not isolate a location’s causal effect. Others emerge from data checks and must be added after inspection. State each in terms of the claim it restricts, rather than using the generic sentence “results may be inaccurate.”
An exclusion is not always a limitation. “Building a live dashboard is out of scope” describes a deliverable boundary. “Do not use this one-time report to monitor future weeks without refreshing and rechecking the data” describes a limit on use. The two may be related, but they answer different questions.
Put it together in a decision-ready brief
A brief can fit on one page if its entries are specific. The following is a draft for agreement, not a claim that the data checks have passed:
Request and decision. Identify sufficiently busy fulfillment locations that meet the agreed persistent late-delivery-gap rule, so the operations team can prioritize follow-up investigation.
Scope and output. Analyze genuine, dispatched two-day orders due in the last eight completed reporting weeks. Deliver weekly location and service-wide rates, eligible due-order counts, flags under the agreed rule, and data-quality findings. Use the agreed deadline, time zone, week boundary, and data-as-of time. Causes, intervention effects, and a recurring dashboard are excluded.
Assumptions to confirm. The delivery event identifies full delivery; location attribution follows the agreed business rule; the event feed is sufficiently current for the final week. Confirm meanings and feed timing with the relevant data owner before accepting the comparison.
Readiness and risks. Check the previously agreed 99% thresholds for resolvable full-delivery status and location attribution. Do not silently classify unknown outcomes. If a check fails, report the affected conclusion as inconclusive, identify the orders and weeks affected, and agree on a remedy or narrower scope before release.
Limitations on use. A flagged location merits investigation, not a causal verdict. The rule does not assess locations below its volume threshold, and these eight weeks do not establish a long-run pattern beyond the observed period.
Agreement. Confirm the decision owner, delivery date, source-field meanings, exclusions, readiness gates, and who will approve any change to the request.
This document should be versioned if an agreement changes. Suppose the stakeholder asks to include orders due in the current, incomplete week. Do not quietly append them: that changes the reporting window and may introduce immature outcomes. Record the proposed change, its effect on comparability, and the agreed decision. If a material assumption proves false, update both the brief and the eventual result; an initial sign-off does not make the assumption true.
The level of documentation and review should also fit the stakes. A quick internal screening report and an analysis used to make consequential decisions may use the same core brief, but the latter warrants more explicit validation, review, and communication of residual uncertainty.
Key takeaways
A sound analytics request records what decision the work supports, what is included and excluded, which assumptions must hold, what could disrupt the work, and how the result may—and may not—be used. Give material risks an owner and a response. Keep present issues distinct from possible risks, and revisit the brief when checks uncover new facts.
You have now completed the decision-focused foundations of the course. The next module begins applying the same discipline to hands-on analysis in Excel: cleaning source data before a metric or recommendation depends on it.