Recommended resources
The freely available resources this lesson will direct you to.
Hello again. The previous lesson separated what a pilot team has verified from what it is still assuming. We will now put that discipline into a drawing. A useful diagram should let an engineer see where media enters, let an operator see what the product delivers, and let a project lead spot an interface that still needs confirmation.
You will create two views of one illustrative edge product: a system-context diagram that defines its boundary, and a data-flow diagram that opens the boundary to show what happens to audio, video, settings, and alerts. The example continues the restricted-area scenario, but adds a proposed microphone-based alarm-sound feature so we can trace audio as well as video. That addition is not an agreed pilot requirement.
First decide what is inside the product
A system-context diagram treats the product as one black box. It answers three questions before anyone debates models or plugins: What are we responsible for? Who or what interacts with it? What crosses its boundary?
Watch the system-context portion of Visualising software architecture with the C4 model by Simon Brown, published by Agile on the Beach. Notice how the central system stays simple while people and external systems give the drawing its meaning.
Visualising software architecture with the C4 model - Simon Brown, Agile on the Beach 2019
Watch Simon Brown sketch the system he is describing and identify its users and external integrations.
Watch the context sketch. Focus on what he leaves out of the central box: its internal applications and data stores.
For our example, define the proposed edge analytics product as the software running on an edge device and its local alert interface. Existing site cameras and a possible site microphone are outside that boundary: the team may consume their media without owning or configuring those devices. The site operator is outside it too. This is a product boundary, not a claim that every external item is on a different network.
System-context diagram: proposed edge audio/video analytics product
Key: Each rectangle names an element and its role. A single-headed line shows the direction of the named data, not a sequence of implementation steps. “TBD” marks an interface detail that must be established; “proposed” marks a design or scope suggestion, not a verified fact.
Read the diagram against the uncertainty register from last lesson. Two accessible camera streams remain an assumption, not a consequence of drawing two cameras. Microphone availability and permission are new open questions. A power outlet and permission to join the camera network are important dependencies, but they are not media-data flows; record them alongside the diagram rather than drawing them as streams. There is no cloud recipient because this candidate design promises only a local alert. Adding a remote alert service later would change the boundary interactions and require a revised diagram.
A context view also avoids implying a technology choice too early. It says “video streams; format and access TBD,” not “RTSP at a verified frame rate,” because this example has not established the site interface. The diagram can still be useful while that question is open.
For a short written distinction between the two views, read the Context diagram and Data-flow diagram (DFD) subsections of Microsoft Learn’s Create architecture design diagrams. They explain why one view hides the internals while the other exposes movement and transformation.
Create architecture design diagrams - Azure
Read the context and data-flow definitions in Microsoft Learn to fix the purpose of each drawing before examining the detailed example.
Under “Types of design diagrams,” read the full “Context diagram” subsection, from the black-box definition. Then read the first paragraph of “Data-flow diagram (DFD),” beginning with its description of how data moves and ending with data lineage and bottlenecks. Ask what information the second view can reveal that the first deliberately conceals.
Open the box to follow the data
The context diagram cannot tell you whether camera frames are stored, where zone settings are used, or whether an audio event is mistakenly treated as proof that a person entered a zone. A data-flow diagram makes those distinctions visible.
Watch the opening of Data Flow Diagram EXAMPLE [How to Create Data Flow Diagrams] from The Business Analysis Doctor – IIBA Certification. The video introduces four useful building blocks—external entities, processes, data stores, and named flows—then shows how a context view can be decomposed. Its numbering conventions are helpful vocabulary, but you do not need to reproduce a formal notation perfectly for this pilot sketch.
Data Flow Diagram EXAMPLE [How to Create Data Flow Diagrams]
Watch the DFD introduction for its treatment of sources, transformations, storage, and the relationship between a context view and a more detailed view.
Start with the definition, then watch the four elements. In the two levels, focus on the move from one system-wide process to internal processes and stores; you can stop when the video begins decomposing further.
We can now open our product boundary. Video is decoded and checked for a zone-entry event. Audio is segmented and checked for an alarm sound. These are separate proposed detections: an alarm sound does not establish that a camera saw an entry, and the diagram makes no claim that the two sources are synchronized. Both can produce event metadata for a local text alert.
Data-flow diagram: proposed local processing and alerts
Key: Rectangles are external people or devices; rounded boxes transform data; cylinders are stores. Each single-headed line names data moving in its indicated direction. The enclosing box is the product boundary, not a guarantee that a connection is trusted or secure. Processes are logical responsibilities, not a prescribed set of programs or containers.
Trace one video input carefully. The camera supplies an encoded stream. Decoding produces frames; zone-entry analysis uses those frames and the configured zone coordinates to produce a candidate event. An event record can then be stored and presented to the operator. The audio path begins with samples and produces a different candidate event. “Candidate” matters: a model output is not automatically a true incident.
Two stores appear for different reasons. The zone configuration is information the operator supplies and the entry process later reads. The event metadata is a proposed record containing such fields as event type, source, time, and score; the alert process reads it. The sketch proposes no raw-media store. That is a design intention, not proof that no raw video or audio can ever be persisted—for example, diagnostic logging or crash handling would need checking. Last lesson’s raw-video restriction was itself still awaiting confirmation, and metadata retention needs a decision too.
Notice what the lines do not specify. They do not establish a frame rate, an alert-latency target, a detection method, or how a process notices a new event record. Those questions belong in requirements, tests, and later design decisions. A data-flow diagram shows where information goes and changes form; it is not a timing trace or a performance result.
Keep the two views consistent
The detailed drawing should account for every material interaction shown at the boundary. Here, camera video reaches video processing, microphone audio reaches audio processing, operator settings reach configuration, and alerts return to the operator. If the detailed view suddenly sent clips to a cloud service, the context view would be missing a recipient. If the context view promised an alert but the detailed view had no path to the operator, the design would be incomplete.
The drawings also serve different audiences. A site representative can review the context diagram to challenge camera ownership, microphone permission, and who receives alerts. An engineer can review the data-flow diagram to ask whether source identifiers survive decoding, where time is attached, and which process reads a stored setting. Neither needs a crowded diagram of every library inside the application.
The following NVIDIA reference drawing is useful for recognizing a different level of detail. It depicts a video-only DeepStream pipeline with decode, stream multiplexing, inference, tracking, and output paths. It is not the proposed pilot architecture, and it does not supply the missing audio path.
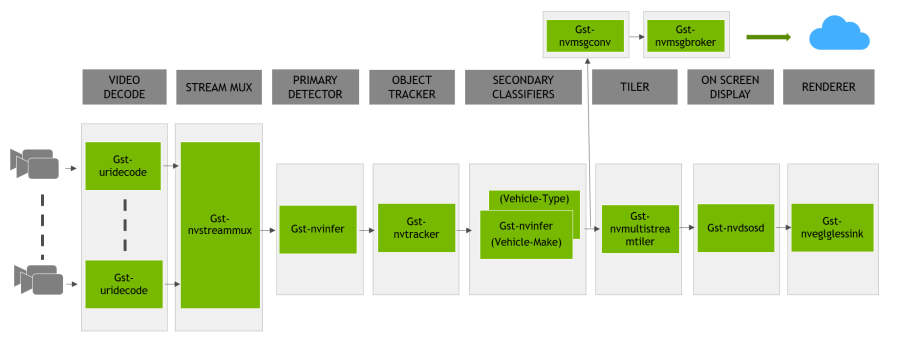
You might eventually choose some of those stages. At this point, drawing a particular detector plugin would make an unmade implementation decision look settled. Start with the questions the diagram must answer, then add a more detailed view when a decision requires it.
Make the drawings reviewable, not merely attractive
Before sharing a diagram, check its title, scope, labels, and key. The C4 model’s Notation guidance is especially practical here: a reader should be able to tell what each box represents and what each directed line means without its author standing beside it.
Read the C4 model’s notation guidance as a review checklist for the two diagrams, rather than as a requirement to adopt a particular drawing tool.
In “Notation,” read the “Diagrams” and “Elements” recommendations from titles through elements. Then, under “Relationships,” read from directed, labeled lines. We have deliberately left unverified interface technologies as TBD instead of inventing labels for them.
For a small pilot, a reviewable pair of diagrams should pass these checks:
- Boundary: Can a reader distinguish the product from existing devices, people, and services it depends on?
- Flow: Does each line say what data moves, with its direction clear? A generic “uses” line usually hides the question you need to resolve.
- Transformation and storage: Can a reader find where raw media becomes candidate detections, and what—if anything—is retained?
- Consistency: Does each external input and output in the context view have a corresponding path in the detailed view?
- Uncertainty: Are proposed features and TBD interfaces visibly different from verified site facts?
Store the drawing with a date or version and update it when an interface test or scope decision changes the answer. A drawing that once described the plan accurately can become misleading after only one new integration choice.
Key takeaways
The system-context diagram defines the product as one box and names its external people, devices, and data exchanges. The data-flow diagram opens that box to show sources, transformations, stores, and outputs. Together they expose boundary assumptions without pretending those assumptions have been verified.
In the next lesson, you will compare build, buy, and open-source options for a pilot component. These diagrams give that decision a useful starting point: they show the component’s intended responsibility and the interfaces it must satisfy before a particular implementation is chosen.