Recommended resources
The freely available resources this lesson will direct you to.
Hello! Welcome to the final lesson in our module on the Van der Waals model.
In the previous lesson, we focused on the behavior right at the critical point, deriving the universal mean-field critical exponents. To do this, we expanded the equation of state around the critical point and largely ignored the complex, S-shaped behavior of the isotherms below , simply using the Maxwell construction to find the equilibrium coexistence line.
Today, we will turn our attention to those very regions we previously bypassed. Our goal is to discuss the concepts of metastability and nucleation in the context of the Van der Waals model. We will discover that the seemingly "unphysical" portions of the Van der Waals isotherms actually describe real, observable, non-equilibrium phenomena: states like superheated liquids and supercooled gases. This exploration will provide a richer understanding of first-order phase transitions, moving beyond equilibrium to the dynamics of how a system transforms from one phase to another.
Revisiting the Van der Waals Isotherms: Beyond Equilibrium
Let's look again at the pressure-volume diagram for a Van der Waals fluid at a temperature .
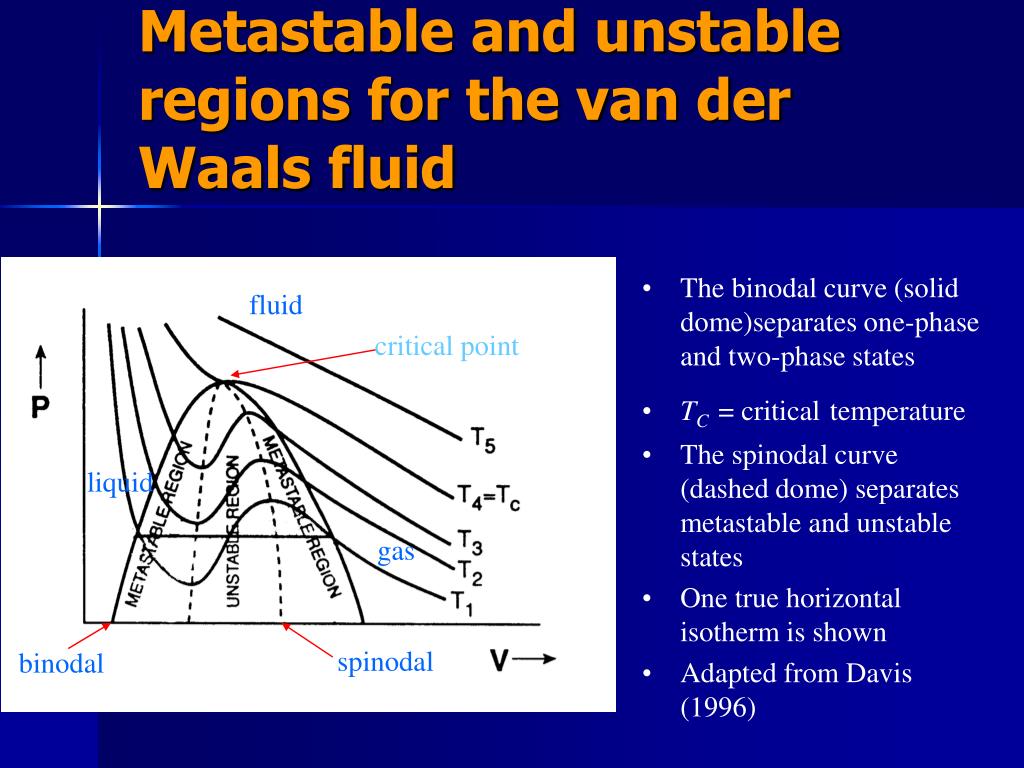
The Maxwell construction gives us the horizontal line, which represents the equilibrium pressure at which the liquid and gas phases coexist. However, the continuous S-shaped curve predicted by the Van der Waals equation itself is not entirely nonsensical. Let's break it down:
- Stable Regions: The parts of the curve outside the dome represent the stable gas (large volume) and stable liquid (small volume) phases.
- Unstable Region: The portion where the slope is positive, , is truly unphysical in a static sense. A positive slope would imply a negative isothermal compressibility, . This means the system would collapse or explode in response to the slightest pressure fluctuation—it is mechanically unstable.
- Metastable Regions: This leaves the two sections of the curve that are inside the coexistence dome but still have a negative slope, . These regions correspond to metastable states.
- The branch connected to the gas phase represents a supercooled or supersaturated vapor. This is a gas that has been compressed to a pressure higher than its equilibrium condensation pressure but has not yet turned into a liquid.
- The branch connected to the liquid phase represents a superheated liquid. This is a liquid that has been expanded to a pressure lower than its equilibrium boiling pressure (it can even be under tension, i.e., negative pressure) but has not yet boiled.
To formalize these boundaries, we use two important curves on the phase diagram:
- The Binodal Curve (or Coexistence Curve): The boundary of the two-phase equilibrium region, determined by the Maxwell construction.
- The Spinodal Curve: The boundary where . This curve separates the metastable regions from the unstable region.
The Free Energy Landscape
Why can a system exist in a metastable state at all? The answer lies in the free energy landscape. In thermodynamics, a system at constant temperature and pressure seeks to minimize its Gibbs free energy, .
- A stable state corresponds to the global minimum of the Gibbs free energy.
- A metastable state corresponds to a local minimum of the Gibbs free energy.
- An unstable state corresponds to a maximum of the free energy.
Think of it like a ball rolling on a hilly landscape. The stable state is the bottom of the deepest valley. A metastable state is the bottom of a smaller, shallower valley. The ball can rest there, but if given enough of a "push," it can roll over the hill and into the deeper valley. The unstable state is the top of a hill, where any tiny nudge will send the ball rolling down.
[PDF] Chapter 1 - Phenomenological Theories of Nucleation
The following chapter from a set of lecture notes provides a clear discussion of these concepts, connecting the VdW isotherms to the free energy landscape.
Please read the introduction (Section 1.1), focusing on Figures 1.1, 1.2, and 1.3. Pay close attention to how Figure 1.2, plotting chemical potential (Gibbs free energy per particle) versus pressure, reveals the stable, metastable, and unstable branches. Section 1.1 also formally defines the spinodal points and Figure 1.3 shows the resulting spinodal and coexistence curves in the phase diagram.
A system in a metastable state is thermodynamically stable against small fluctuations but not large ones. It's trapped in a local minimum and needs to overcome an energy barrier to reach the true global minimum (the stable phase). This brings us to the mechanism for escaping a metastable state.
Nucleation: Escaping the Local Minimum
How does a superheated liquid start to boil, or a supercooled vapor start to condense? The process is called nucleation. It begins with a random thermal fluctuation that creates a tiny embryonic droplet (in a vapor) or bubble (in a liquid) of the new, more stable phase.
This process is governed by a competition between two energy contributions, as described by Classical Nucleation Theory (CNT).
The Free Energy Cost of a Nucleus
Let's consider the formation of a spherical liquid droplet of radius within a supersaturated vapor. The change in Gibbs free energy, , to form this droplet has two competing terms:
-
Bulk (Volume) Term: The liquid phase has a lower free energy per unit volume than the metastable vapor. This term is favorable, scales with the volume of the droplet, and is negative.
where is the free energy difference per unit volume between the metastable vapor and the stable liquid. -
Surface Term: Creating an interface between the liquid droplet and the surrounding vapor costs energy, due to surface tension (). This term is unfavorable, scales with the surface area, and is positive.
The total free energy cost is the sum:
Plotting versus shows that for small , the positive surface term dominates, creating an energy barrier. For large , the negative bulk term dominates, and the droplet grows spontaneously.
The Critical Nucleus
The peak of this energy barrier occurs at the critical radius, . We find it by setting the derivative to zero:
- Droplets smaller than are more likely to shrink and disappear, as this lowers their free energy.
- A droplet that, by chance, reaches the size is called a critical nucleus. It is at the top of the energy barrier and is equally likely to grow or shrink.
- Droplets larger than will spontaneously grow, lowering the system's free energy and driving the phase transition.
The height of the energy barrier is :
The probability of forming a critical nucleus via thermal fluctuations is proportional to the Boltzmann factor . This means the lifetime of a metastable state is exponentially dependent on the height of this nucleation barrier. The deeper you quench into the metastable region (further from the coexistence curve), the larger becomes, which lowers both and , making nucleation much more likely and the metastable state shorter-lived.
Simulating and understanding phase change | Guest video by Vilas Winstein
This phenomenal video provides a beautiful visual and conceptual explanation of metastability and nucleation. It simulates a model very similar in spirit to what we've been discussing.
Please watch the segment from 33:20 to 35:21. The narrator explains and demonstrates exactly the phenomenon we've just discussed: how the system can remain in a metastable 'gas' phase even when the parameters favor the 'liquid' phase, and how the introduction of a sufficiently large droplet (a critical nucleus) triggers the phase transition.
Test your understanding!
Why does homogeneous nucleation (nucleation without impurities) rarely happen in everyday life when you boil water? Why does water in a clean pot typically boil at 100°C and not become superheated?
Show answer
Homogeneous nucleation requires overcoming the full energy barrier in the bulk of the fluid. In practice, tiny imperfections on the surface of the pot, dissolved gases, or specks of dust act as heterogeneous nucleation sites. It costs less free energy to form a bubble on a pre-existing surface than to form one in the bulk fluid. These sites effectively lower the nucleation barrier, , so drastically that boiling occurs as soon as the temperature reaches the boiling point, preventing the liquid from becoming significantly superheated.
Nucleation vs. Spinodal Decomposition
Finally, let's contrast the decay of a metastable state with that of an unstable state.
- Metastable State (Decay via Nucleation): The system is in a local free energy minimum. It needs to overcome an energy barrier. The transition starts with the formation of isolated, compact droplets of the stable phase which then grow. This happens between the binodal and spinodal lines.
- Unstable State (Decay via Spinodal Decomposition): The system is at a free energy maximum. There is no barrier to decay. Any infinitesimal fluctuation lowers the free energy and will grow spontaneously. This results in a very different morphology, where the new phase appears everywhere at once in a complex, interconnected, sponge-like pattern. This happens inside the spinodal line.
The resource from Klein et al. (LINK) shows excellent experimental images of this contrast in Section 1.2 (Figure 1.4), which you may find insightful to look at.
Conclusion
Today we have unearthed the rich physical meaning hidden within the Van der Waals isotherms. What first appeared to be unphysical artifacts of a simple model are now understood as predictions of the fascinating non-equilibrium phenomena of metastability and nucleation.
Key Takeaways:
- The VdW isotherms below describe stable, metastable, and unstable states.
- Metastable states (e.g., superheated liquid, supercooled vapor) correspond to local minima in the free energy landscape. They are long-lived but not the true thermodynamic ground state.
- The boundary of mechanical stability is the spinodal curve, where .
- Systems escape metastable states via nucleation, where a thermal fluctuation must overcome a free energy barrier () to form a critical nucleus of the new phase.
- The size of the critical nucleus () and the height of the energy barrier () depend on the surface tension and how far the system is from equilibrium.
Preview of the Next Lesson:
We have now thoroughly explored our first major toy model of a phase transition. While incredibly insightful, the Van der Waals model is a phenomenological, mean-field theory. In the next module, we will move to a more fundamental, microscopic description by introducing the Ising Model. We will start by formulating its Hamiltonian and then, in a major theoretical step, solve the one-dimensional version exactly using the transfer matrix method. This will allow us to investigate phase transitions from a microscopic statistical mechanics perspective.