Recommended resources
The freely available resources this lesson will direct you to.
In our last lesson, you built a complete trading signal in Pine Script, defining the precise rules for entering and exiting a trade. Having a working strategy is an exciting step, but it's also where the real work of a quantitative trader begins. A profitable-looking backtest in TradingView's Strategy Tester can be dangerously misleading.
This lesson is about developing a professional, skeptical mindset and learning the tools to rigorously validate a trading idea. Your goal is to evaluate a signal using chronological training and test periods, while critically checking for the most common traps: look-ahead bias, transaction costs, and parameter overfitting. We will move beyond simply running a backtest to understanding how to design a valid test that gives you confidence in a strategy's future performance.
Given your background in engineering and development, you'll appreciate that this process is akin to software testing: we're trying to find every possible way our logic could fail before deploying it in a live environment. We will primarily use Python for this deeper analysis, as it offers more flexibility for robust validation frameworks.
1. The Backtester's Crime Scene: Common Pitfalls
Many strategies that appear brilliant in backtests fail spectacularly in live markets. This isn't always due to market conditions changing; often, the backtest itself was flawed from the start. Before we learn the right way to test, we must first understand the pitfalls.
The following video provides an excellent, high-level overview of the three most common and destructive biases in backtesting. The presenter aptly calls a good-looking backtest a "crime scene" until proven otherwise—a mindset we will adopt.
3 Backtesting Pitfalls That Ruin Your Trading Strategy
This video covers the key pitfalls that can invalidate a backtest.
Watch the following segments to understand the core concepts: Introduction: The Problem Look-ahead Bias: The first pitfall, which involves accidentally using future information. Overfitting (Data Snooping): The second pitfall, where a strategy is tuned too closely to historical data. Transaction Costs: The accomplices, which are the real-world costs that erode profitability.
To solidify these ideas, let's review them with concise definitions. The following reading summarizes these biases and introduces the framework we'll use to combat them.
How to Backtest, Strategy, Analysis, and More
This article section defines the key mistakes made during backtesting.
Read the section titled Common mistakes while backtesting. Pay close attention to the definitions of Overfitting, Look-ahead bias, and Ignoring trading costs.
These are not just theoretical concerns. Even a tiny amount of look-ahead bias can turn a losing strategy into a seemingly stellar one. Ignoring a commission of just 0.04% per trade (a realistic cost) can be the difference between profit and loss for a frequent-trading strategy.
2. From Verification to Falsification: Walk-Forward Analysis
The most insidious of these pitfalls is overfitting (or data snooping). This occurs when you test many different parameters for your strategy (e.g., different moving average lengths) and select the combination that performed best on historical data. You haven't discovered a robust market pattern; you've simply curve-fit your strategy to past noise.
To counter this, we must separate the period we use for optimization from the period we use for evaluation. This is the core idea behind in-sample and out-of-sample testing.
- In-Sample (Training) Period: A slice of historical data used to find the optimal parameters for a strategy.
- Out-of-Sample (Test) Period: A subsequent, "unseen" slice of data used to evaluate how well the optimized strategy performs.
A significant drop in performance from the in-sample to the out-of-sample period is a major red flag for overfitting.
Walk-Forward Analysis is a powerful and systematic application of this principle. It involves sliding a training and testing window through your entire dataset, re-optimizing the strategy on each new training set, and evaluating it on the following test set. The out-of-sample results are then stitched together to create a more realistic picture of the strategy's historical performance.
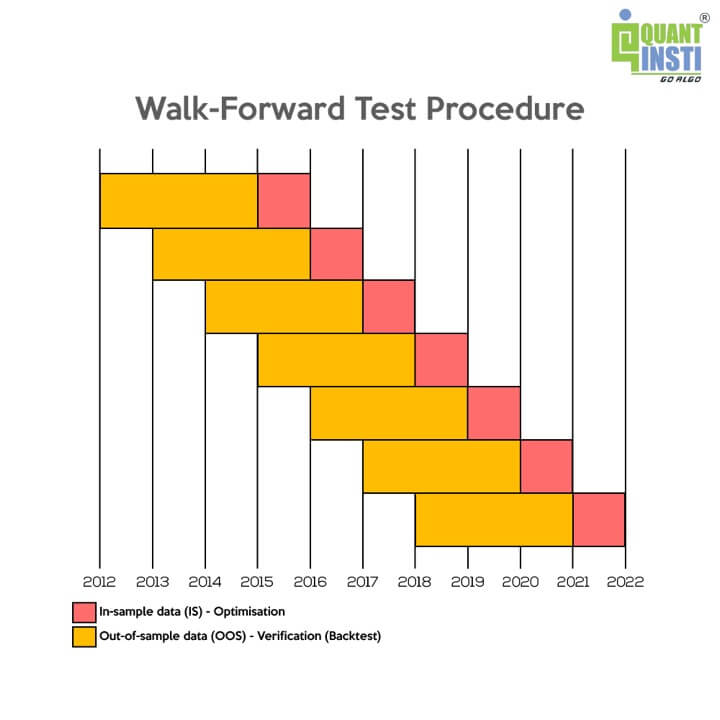 This diagram from the QuantInsti article illustrates the walk-forward process. The strategy is optimized on a blue "in-sample" window and then tested on the subsequent orange "out-of-sample" window. This process repeats over time.
3. Implementing Walk-Forward Analysis in Python
While you can approximate this process manually in Pine Script by adjusting date ranges, Python provides a much more powerful and flexible environment for this kind of analysis. The backtesting.py library is an excellent tool for this.
The following video is a detailed, practical guide to implementing a full walk-forward optimization workflow in Python. Given your development expertise, you can focus on the structure of the code and the logic of the validation process. We'll concentrate on three key parts: the conceptual overview, the core walk-forward function, and the final visualization of the out-of-sample results.
Walk Forward Optimization in Python with Backtesting.py
This video provides a complete Python implementation of walk-forward analysis.
Focus on these key segments to understand the workflow: Conceptual Overview: The methodology. The presenter explains the logic of rolling training (optimization) and validation (testing) windows. The walk_forward Function: The core function. This is the heart of the implementation. Observe how the code loops through the data, slices it into training and validation sets, runs the optimization on the training data, and then runs the final test on the validation data with the optimized parameters. Plotting the Combined Equity Curve: The final result. This is the most crucial output. The code stitches together the equity curves from only the out-of-sample periods to create a single, continuous performance chart. This represents a much more honest assessment of the strategy's historical edge than a simple backtest over the entire period.
The key takeaway from this workflow is the final, combined out-of-sample equity curve. If that curve is still profitable after accounting for transaction costs, you have much stronger evidence that your strategy has a genuine edge and isn't just a product of overfitting.
4. Putting It All Together: A Checklist for Robust Evaluation
Now, let's consolidate these ideas into a practical checklist you can apply to any strategy you develop.
-
Define Realistic Costs in Your Backtest.
- In Pine Script, you can set this in the
strategy()declaration line. For example:strategy("My Strategy", commission_value=0.04, commission_type=strategy.commission.percent, slippage=2). commission_value: The cost per trade. 0.04% is a reasonable starting point for liquid futures or equities.slippage: The number of ticks your order might be filled worse than the price on the chart. This simulates the cost of crossing the bid-ask spread and the market impact of your order.- In
backtesting.py, this is done when creating theBacktestobject, as shown in the video.
- In Pine Script, you can set this in the
-
Guard Against Look-ahead Bias.
- Execution Model: Pine Script's default model (calculate on bar close, execute on next bar open) prevents the most basic form of look-ahead bias. Be wary of any settings that change this.
- Data Availability: Be critical about the data you use. For example, if you're using company fundamentals, ensure you're using the data as of its reporting date, not a later restatement date. A professional data source will provide "point-in-time" data to solve this.
- Framing: As the ML for Trading chapter excerpt suggests, frame backtesting as falsification. Your goal is to actively try to disprove your strategy. Ask yourself: "What information could I be using here that I wouldn't have had in real time?"
-
Fight Overfitting with Out-of-Sample Testing.
- Simple Split: At a minimum, divide your data into two or three chronological parts. Optimize on the first part(s) and hold the last part back as a final, completely unseen test set.
- Walk-Forward Analysis: For a more robust test, implement the walk-forward methodology shown in the Python video. This is the professional standard.
- The Litmus Test: Your primary check is the performance degradation between your in-sample (optimized) results and your out-of-sample (validation) results. A small drop is expected, but a large collapse indicates severe overfitting. The strategy should be discarded or re-thought.
-
Evaluate Key Performance Metrics.
- After running a robust test, you need to interpret the results. Look beyond just the final return.
- Sharpe Ratio: Measures risk-adjusted return. A value > 1 is often considered good, but this depends on the asset class and timeframe. The key is to see if it remains positive and reasonable in the out-of-sample periods.
- Maximum Drawdown: The largest peak-to-trough drop in equity. This represents the worst pain you would have had to endure holding the strategy. Is it a level you can psychologically and financially tolerate?
- Profit Factor: Gross profits divided by gross losses. A value > 1.5 is a healthy sign.
By following this rigorous process, you move from simply coding a strategy to building a robust, evidence-based case for its viability.
Conclusion
In this lesson, we've made the crucial transition from signal implementation to signal evaluation. You've learned that a compelling backtest is often an illusion, and have armed yourself with the critical concepts and practical tools to see through it.
Key Takeaways:
- A Skeptical Mindset is Key: Treat every backtest as a "crime scene" and actively search for flaws. Your default assumption should be that the strategy does not work.
- The Three Main Pitfalls: Be vigilant against look-ahead bias (using future data), overfitting (curve-fitting to past noise), and underestimating transaction costs.
- Walk-Forward Analysis is the Gold Standard: This method of using rolling in-sample (training) and out-of-sample (testing) windows is your most powerful defense against overfitting.
- Out-of-Sample Performance is What Matters: The final, stitched-together equity curve from your out-of-sample periods provides the most realistic estimate of a strategy's historical performance.
You now possess the methodology to test a trading idea like a professional quantitative analyst. With the ability to code a signal and rigorously evaluate it, the final step in this module is to learn how to present your findings.
In the next lesson, we will focus on how to generate a reproducible chart-and-data evidence report for a commodity and a related listed company. This will involve combining your Python and Pine Script skills to create a clear, concise summary of your analysis, suitable for making a final trading decision.