Recommended resources
The freely available resources this lesson will direct you to.
Hello! Welcome back to our deep dive into Japan's deflationary experience.
In our last lesson, we constructed a detailed timeline of Japan's economic journey from the bubble's burst in 1990 to the present day. We identified distinct phases, from the initial disinflation and banking crisis to the era of Abenomics and the recent return of inflation.
Introduction
Today, we will build directly on that timeline to address the learning outcome: Map the major monetary and fiscal policy responses to the corresponding phases of Japan's deflationary timeline.
We will overlay the key policy decisions onto the economic phases we've already defined. This will create a comprehensive picture of what actions Japanese policymakers took in their decades-long battle against economic stagnation and falling prices. Understanding this policy map is essential before we can begin to evaluate its effectiveness in subsequent lessons.
- Estimated time to complete: 60 minutes.
- Recap: We previously identified four main phases of Japan's post-bubble economy:
- 1990-1997: Bubble Burst & Disinflation
- 1998-2002: Debt-Deflation & Banking Crisis
- 2003-2012: Expectations Trap & Global Financial Crisis (GFC)
- 2012-Present: Abenomics & The Return of Inflation
1. The Policy Toolkit: An Overview
Before we map the policies to our timeline, it's useful to have a clear definition of the main tools used by the Bank of Japan (BOJ) and the Ministry of Finance.
Reading (5 minutes):
Please read the introductory section of the following Federal Reserve memo. It provides concise definitions for the key monetary policy acronyms we will encounter.
As you read, focus on the definitions of:
- LIRP (Low Interest Rate Policy): Policy rate > 0 and ≤ 0.5%.
- ZIRP (Zero Interest Rate Policy): Policy rate at zero.
- QEP (Quantitative Easing Policy): Shifting the policy target from the interest rate to a quantitative measure, like bank reserves.
On the fiscal side, the main tools were government spending (primarily public works) and tax changes (both cuts and hikes).
2. Mapping Monetary Policy to the Timeline
The Bank of Japan's response evolved dramatically over time, moving from conventional tools to increasingly experimental ones.
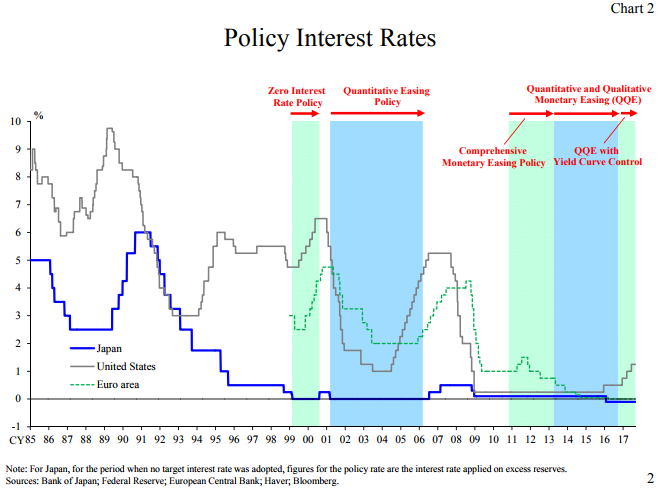
This chart provides an excellent visual summary of the Bank of Japan's policy rate journey from 1985 to 2017, contrasting it with the US and Euro area. The shaded regions clearly mark the different policy regimes we will discuss. Keep this image in mind as we move through the phases.
Phase 0 & 1 (1990-2002): Conventional Easing, ZIRP, and the First QE
The initial response to the bubble's collapse was conventional: cutting interest rates. However, as the situation worsened, the BOJ was forced into uncharted territory.
Reading (10 minutes):
Please read the following sections from the Federal Reserve memo on monetary policy. They detail the policy actions during the first two phases of our timeline.
Based on this reading, we can map the key monetary policies:
- 1991-1995 (Phase 0): The BOJ engaged in conventional easing, cutting the policy rate from its 1989 peak. As the memo notes, this response was criticized in hindsight as too slow. By late 1995, Japan entered its first period of Low Interest Rate Policy (LIRP), with the rate at 0.5%.
- 1997-1998 (Phase 1): The Asian Financial Crisis and a domestic banking crisis pushed the economy into a deep recession.
- February 1999 (Phase 1): With the economy still reeling, the BOJ took the historic step of introducing its Zero Interest Rate Policy (ZIRP).
- August 2000 (Phase 1): In a move that is now almost universally considered a major policy error, the BOJ exited ZIRP, raising the rate to 0.25%. This coincided with the global collapse of the tech boom, tipping Japan back into recession.
- March 2001 (Phase 1): Forced to reverse course, the BOJ not only returned the policy rate to zero but also launched its Quantitative Easing Policy (QEP). This was a pivotal moment, shifting the focus from the price of money (interest rates) to the quantity of money in the banking system.
Phase 2 (2003-2012): QEP in Practice and the GFC
This period was dominated by the implementation and eventual unwinding of the first wave of QE, followed by the shock of the Global Financial Crisis.
Reading (8 minutes):
Now, read the next section of the same memo, which details the mechanics and evolution of the QEP.
Key policy events during this phase include:
- 2001-2004: The BOJ steadily expanded QEP, raising its target for current account balances (reserves) at the bank from ¥5 trillion to ¥35 trillion. It also expanded its asset purchases to include long-term Japanese Government Bonds (JGBs), stocks held by banks, and commercial paper.
- March 2006: With the economy showing signs of recovery, the BOJ ended QEP and, in July, raised the policy rate to 0.25%. This exit was, once again, arguably premature as core deflation had not been vanquished.
- 2008-2009: The Global Financial Crisis hit Japan's export-oriented economy hard, forcing the BOJ to cut rates back toward zero and re-implement measures reminiscent of QEP to provide liquidity.
Phase 3 & 4 (2012-Present): "Abenomics" and the Unconventional Toolkit
The failure to generate sustained inflation led to a radical escalation of monetary policy under Prime Minister Shinzo Abe.
Video (5 minutes):
This segment from Bloomberg provides a clear and engaging overview of the highly unconventional policies deployed during the Abenomics era.
The key policy innovations of this era were:
- 2013: Quantitative and Qualitative Easing (QQE): This was a super-sized version of QEP. The BOJ committed to doubling the monetary base and massively increasing its purchases of JGBs and riskier assets like stock market ETFs and real estate investment trusts (J-REITs), all in an effort to hit a new, explicit 2% inflation target.
- 2016: Negative Interest Rate Policy (NIRP): To provide further stimulus, the BOJ began charging commercial banks a small fee (0.1%) on a portion of their reserves held at the central bank.
- 2016: Yield Curve Control (YCC): In another world-first, the BOJ shifted its policy target again. It committed to keeping the 10-year JGB yield at around 0% by buying whatever amount of bonds was necessary. This was an attempt to control the entire structure of interest rates, not just the short-term policy rate.
These policies remained in place for years until, driven by global inflationary pressures, the BOJ finally ended NIRP and YCC in March 2024, as mentioned in the video.
3. Mapping Fiscal Policy to the Timeline
Fiscal policy was the other major lever used to combat deflation, but its application was often sporadic and poorly coordinated with monetary policy.
Reading (8 minutes):
Please read the following sections from the Federal Reserve memo on fiscal policy. It outlines the timing, composition, and key criticisms of the government's efforts.
From this reading, we can identify the key fiscal policy trends:
- 1992-2000 (Phases 0 & 1): "Stop-Go" Stimulus: This period saw two major waves of fiscal expansion (1992-95 and 1998-2000). The stimulus was heavily weighted towards public investment (infrastructure projects). However, these efforts were undermined by their "stop-go" nature. Most notoriously, the government implemented a consumption tax hike in April 1997, which crippled domestic demand just as the Asian Financial Crisis was breaking.
- 2001-2011 (Phase 2): Fiscal Consolidation: As the memo highlights, concerns about rising government debt led to a shift towards a neutral or contractionary fiscal stance. This occurred precisely when the BOJ was implementing its QEP. This lack of coordination between monetary and fiscal authorities is a central theme in the analysis of Japan's lost decades.
- 2012-Present (Phases 3 & 4): Abenomics' "Second Arrow": Fiscal policy was one of the "three arrows" of Abenomics. While there were initial spending packages, the "stop-go" pattern repeated itself with consumption tax hikes in 2014 and 2019, both of which triggered economic slowdowns and worked against the BOJ's inflationary goals.
4. Synthesis: A Policy Timeline
Let's bring everything together in a single table that maps the major policy responses to the deflationary phases we defined in the last lesson. This table directly addresses today's learning outcome.
| Phase | Period (Approx.) | Economic Conditions | Monetary Policy Response | Fiscal Policy Response |
|---|---|---|---|---|
| 0 & 1 | 1990-2002 | Bubble burst, disinflation, banking crisis, debt-deflation. | • Rate cuts (1991-95) • LIRP (1995) • ZIRP (1999) • Premature rate hike (2000) • QEP launch (2001) |
• Two waves of stimulus (1992-95, 1998-2000) • Heavy focus on public works • Ill-timed consumption tax hike (1997) |
| 2 | 2003-2012 | Expectations trap, mild deflation, GFC shock. | • QEP expansion (2001-06) • Premature exit from QEP (2006) • Rate cuts post-GFC (2008) |
• Fiscal consolidation / neutral stance • Poor coordination with BOJ's QEP |
| 3 | 2012-2020 | Abenomics era, fight for 2% inflation. | • QQE launch (2013) • NIRP (2016) • YCC (2016) |
• Initial stimulus packages • Undermined by consumption tax hikes (2014, 2019) |
| 4 | 2020-Present | Pandemic, global supply shocks, return of inflation. | • Maintained QQE/YCC • Ended NIRP/YCC (March 2024) |
• Pandemic-related support measures |
For a highly detailed, date-by-date breakdown of the BOJ's decisions from 1998 to 2008, I encourage you to review the timeline table in the monetary policy memo. It provides a granular view of the decisions we've discussed.
Optional Deeper Dive (5 minutes):
Skim the detailed timeline table in Overview of Japan's Monetary Policy Responses to Deflation (Timeline of the Bank of Japan's Monetary Policy Decisions). Note the frequency of meetings and the specific changes to targets and purchase amounts.
Conclusion
In this lesson, we have systematically mapped Japan's major monetary and fiscal policy responses onto the timeline of its deflationary era. We've seen a clear evolution in the policy toolkit, particularly on the monetary side, from conventional interest rate adjustments to a suite of radical, unconventional experiments.
Key Takeaways:
- Monetary policy evolved in stages: from conventional rate cuts (LIRP) to ZIRP, then to an initial phase of Quantitative Easing (QEP), and finally to the "all-in" approach of Abenomics with QQE, Negative Rates (NIRP), and Yield Curve Control (YCC).
- Policy mistakes were made: Several premature attempts to "normalize" policy by raising rates or ending QE (in 2000 and 2006) set back the recovery.
- Fiscal policy was inconsistent: Large stimulus packages, heavily focused on infrastructure, were often followed by fiscal consolidation or ill-timed tax hikes that undermined the stimulus.
- Coordination was lacking: A critical failure was the lack of synchronization between monetary and fiscal policy, especially in the 2000s when the BOJ was easing aggressively while the government was tightening its belt.
Next Lesson Preview:
Now that we have established what policies were implemented and when, the natural next question is: did they work? In our next lesson, we will begin to answer that by focusing specifically on the monetary side. We will evaluate the effectiveness of Japan's monetary policy responses, including Zero Interest-Rate Policy (ZIRP) and Quantitative Easing (QE).