Recommended resources
The freely available resources this lesson will direct you to.
Hello! Welcome back to our course on architecting security products.
In our last lesson, we designed a compliance mapping system that brilliantly translates low-level CSPM findings into high-level reports for frameworks like SOC 2 and PCI-DSS. This gives us a clear, point-in-time snapshot of our compliance posture. However, the cloud is not static. A perfectly compliant environment at 9:00 AM can be rendered vulnerable by a single misconfiguration at 9:01 AM. The time between our periodic scans creates a "detection gap"—a window of opportunity for attackers.
Today, we will close that gap. Our learning outcome is to: Design a drift detection system to track configuration changes over time and trigger alerts on policy violations.
We'll architect the components needed to evolve our CSPM from a periodic scanner into a continuous, real-time monitoring system that detects and reacts to changes as they happen.
1. Understanding Configuration Drift
At its core, configuration drift is the divergence between the intended state of your infrastructure and its actual state in the live environment.
- Intended State: This is your source of truth. For modern infrastructure, this is typically defined in Infrastructure as Code (IaC) templates (e.g., Terraform, CloudFormation) stored in a Git repository.
- Actual State: This is the real configuration of resources running in your cloud provider's environment.
Drift occurs for many reasons: an engineer making an emergency change via the AWS console ("click-ops"), a script running a CLI command to fix an urgent issue, or even automated processes by the cloud provider itself.
Why does this matter? Because every second a critical resource remains in a non-compliant, drifted state, your organization's attack surface is exposed.
Real-Time Drift Detection vs Scheduled Scans: Why Minutes Matter - Complimetric Blog | Complimetric
The article 'Real-Time Drift Detection vs Scheduled Scans' provides a compelling, data-driven argument for why minimizing detection time is paramount in cloud security.
Please read the first section of the article, down to 'Three Approaches to Drift Detection.' Pay close attention to the statistics from the IBM report and the 'Risk Multiplier' table. This quantifies the value proposition of the system we are about to design.
As the article makes clear, reducing detection time from hours to minutes fundamentally transforms your risk profile. Our goal as architects is to build a system that makes this reduction possible.
2. Architectural Approaches to Drift Detection
There are three primary architectural patterns for detecting drift, each with distinct trade-offs in terms of speed, coverage, and complexity. Your software engineering background in evaluating trade-offs will be key here.
Let's explore these patterns, using the Complimetric blog post as our guide.
Real-Time Drift Detection vs Scheduled Scans: Why Minutes Matter - Complimetric Blog | Complimetric
This next section of the same article provides an excellent breakdown of the three main architectural approaches to drift detection.
Read the section 'Three Approaches to Drift Detection' and study the 'Detailed Comparison' table carefully. This will provide the architectural context for our design session.
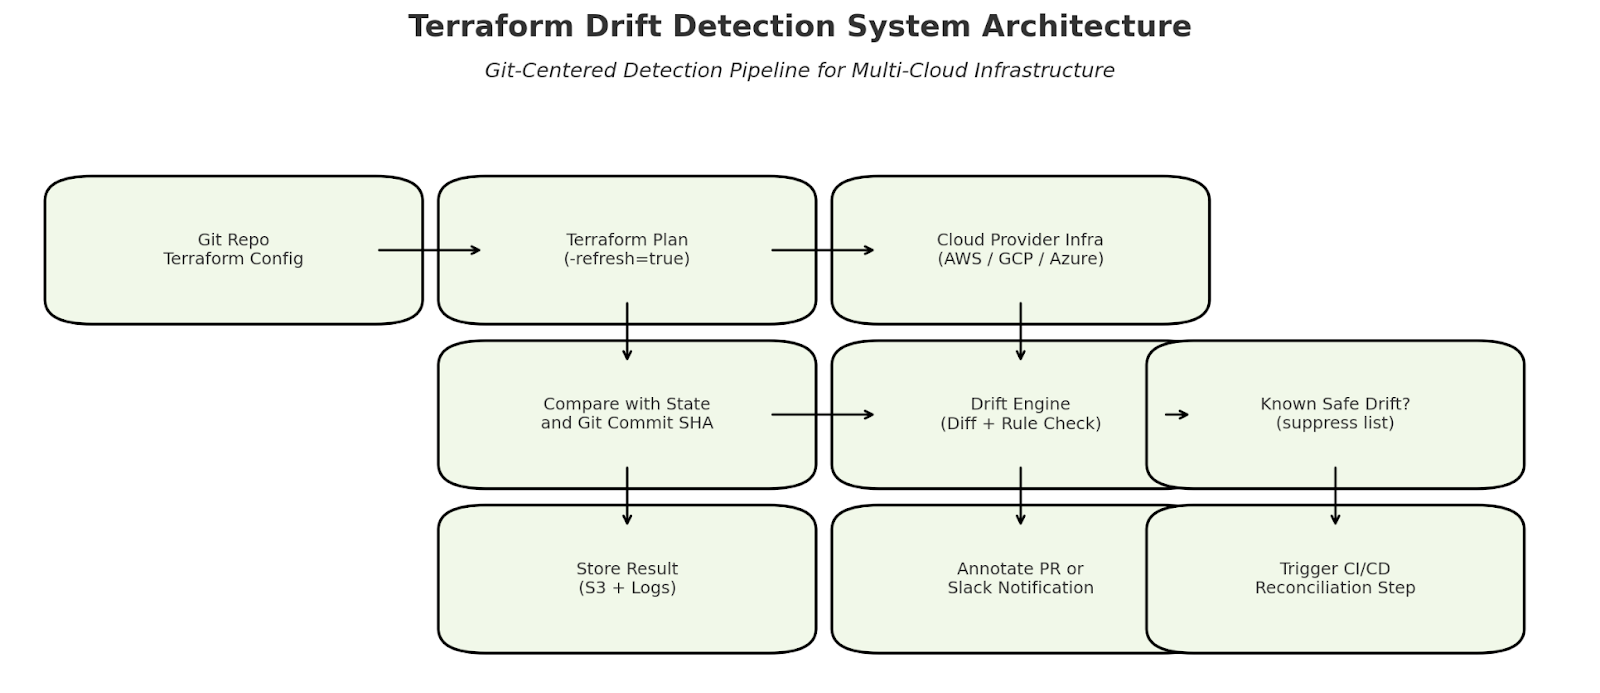
Let's visualize two of these competing architectures:
Approach 1: Scheduled Scans (State Reconciliation)
This is the traditional model. A scheduled process runs, compares the live environment to a known good state, and reports the differences.
Approach 2: Event-Driven Detection
This model shifts from polling to listening. The system subscribes to event streams from the cloud provider and reacts to change events in real time.

As the comparison table in the article shows, the Real-Time Hybrid model, which combines the completeness of scheduled scans with the speed of event-driven detection, offers the most robust solution. This is the architecture we will design for our CSPM.
3. Designing a Hybrid Drift Detection System
Our goal is to create a system that knows about changes instantly via events but also periodically verifies the entire state to ensure nothing was missed. We'll break the architecture down into four key components.
Component 1: Multi-Source Change Ingestion
We need to ingest change information from two primary sources:
-
IaC Repositories (The "Intended State" Feed):
- Mechanism: Use Git webhooks on your infrastructure repositories (GitHub, GitLab, etc.).
- Flow: On every
git push, a webhook notifies our system. A handler parses the changed IaC files (e.g., Terraform HCL) to update our internal representation of the intended state. - Context Gained: We know who made the change (commit author), why (commit message), and when.
-
Cloud Provider Event Streams (The "Actual State" Feed):
- Mechanism: Subscribe to the native eventing services of each cloud provider.
- Flow: Events are streamed to a central ingestion point, such as an Amazon Kinesis stream, Azure Event Hub, or Google Pub/Sub topic.
- Examples:
- AWS: CloudTrail events delivered via EventBridge.
- Azure: Azure Activity Log events streamed to an Event Hub.
- GCP: Cloud Audit Logs exported to a Pub/Sub topic.
This dual-source ingestion is the foundation of the hybrid model.
Component 2: Event Processing and Evaluation Pipeline
Raw events are just noise. We need a pipeline to transform them into actionable intelligence. This is a classic data processing challenge, much like those you've likely encountered in other distributed systems.
Event-Driven Cloud Security Architecture: Implementation Guide
The article 'Event-Driven Cloud Security Architecture: Implementation Guide' provides an exceptional deep-dive into the design of such a pipeline. It articulates the 'first principles' of treating every state change as a security signal.
Please read the sections 'The Event-Driven Security Lifecycle' and 'Core Components of Event-Driven Cloud Security Architecture,' focusing on the 'Event Processing Pipeline' subsection. This describes the stages from raw data to actionable intelligence.
Based on this, we can design our processing pipeline in four stages:
-
Collection & Normalization: An ingestion service consumes events from our Kinesis/Event Hub/Pub/Sub topics. It parses the various provider-specific formats into a single, canonical event schema for our CSPM (e.g.,
{principal, action, resource, timestamp, payload}). -
Contextual Enrichment: A second service enriches the normalized event. For a given change, it asks:
- Resource Context: What is this resource? Is it tagged as
production? Does it processpii-data? - Identity Context: Who made this change? Is it a user or a service account? Are they a privileged admin?
- Threat Intelligence Context: Is the source IP on a known-bad list?
- Resource Context: What is this resource? Is it tagged as
-
Drift Comparison & State Update: The enriched event, representing a change in the actual state, is now compared against our intended state (from the IaC source).
- If the change aligns with a recent IaC commit, it's an expected change. We can log it and move on.
- If the change does not align with any known IaC commit, this is drift.
-
Policy Evaluation: When drift is detected, the new configuration of the affected resource is sent to the Policy Engine we've previously discussed. The engine evaluates the new state against all relevant CSPM rules.
If the policy engine returns a FAIL status for any rule, we have a policy violation.
Component 3: The Reconciliation Loop
Event streams are fast but not infallible; events can be dropped or delayed. To ensure completeness, a separate, scheduled process performs a full state reconciliation.
- Mechanism: A scheduled job (e.g., a daily cron job running a serverless function) iterates through all managed resources.
- Flow: For each resource, it queries the cloud provider API to get its live configuration. It then compares this against the last known state in our CSPM's database.
- Function: This catches drift that was missed by the event stream and corrects any inconsistencies in our system's view of the world. It also serves as the initial population mechanism when onboarding a new cloud account.
Component 4: Alerting and Response
When the evaluation engine identifies a policy violation, the final component takes over.
-
Severity Classification: The finding is assigned a severity (e.g., Critical, High, Medium) based on the violated rule and the enriched context of the resource. A public S3 bucket is
Critical; a mis-tagged development instance isLow. -
Alert Routing: The finding is routed to the appropriate destination based on its severity.
- Critical: Send to PagerDuty to wake up the on-call engineer.
- High: Post to a
#security-alertschannel in Slack. - Medium/Low: Create a Jira ticket and assign it to the resource owner's team.
-
Automated Response (Advanced): For certain high-confidence violations, the system could trigger an automated remediation workflow. For example, if a security group is opened to the world (
0.0.0.0/0), a "quarantine" function could be invoked to immediately replace that rule with one that denies all traffic. We will explore this in more detail in a future lesson.
Conclusion
In this lesson, we have designed the architecture for a sophisticated, hybrid drift detection system. By moving beyond simple, periodic scanning, we have transformed our CSPM into a dynamic system that provides continuous visibility and enables rapid response.
Key Takeaways:
- Drift is Inevitable: In any complex cloud environment, drift will occur. The architectural goal is to detect it as fast as possible to minimize risk.
- Hybrid is Best: A hybrid architecture combining real-time event streaming for speed and periodic full reconciliation for completeness provides the most robust solution.
- Processing is Key: The core of the system is an event processing pipeline that can normalize, enrich, and evaluate change events against a policy engine.
- Connect to Existing Components: Drift detection doesn't exist in a vacuum. It is the trigger mechanism that feeds our existing policy engine, which in turn generates the findings for our compliance reporting system.
Preview of the Next Lesson
Our system can now generate findings in real time. But what happens next? How do we manage the potential flood of alerts? How do we design remediation workflows that are safe and effective?
In our next lesson, we'll address these questions by designing the components that consume the output of our drift detection system. The learning outcome will be: Design a findings pipeline including severity classification, notification routing, and a secure auto-remediation framework. We will build the systems needed to manage findings at scale and move from detection to resolution.