Recommended resources
The freely available resources this lesson will direct you to.
- Net Revenue Retention for SaaS: Key Metric or Disguise for Disappointing Performance?www.youtube.com
- 7 Essential SaaS Metrics to Spot a Winning Investmentwww.youtube.com
- ServiceNow Reports First Quarter 2024 Financial Results - ServiceNow Newsroomnewsroom.servicenow.com
- Microsoft 2025 Annual Reportwww.microsoft.com
Hello. Last lesson mapped where profit accumulates across an industry value chain. The next challenge is keeping that map current: earnings materials and filings contain operating metrics that can signal changes in demand, customer behavior, and cost structure before those changes are obvious in reported profit.
This lesson is about interpreting those signals without mistaking them for one another. You will read a software earnings release and a diversified technology company’s annual report, then extend the same approach to platforms, payments, cloud, and AI-native businesses. Allow about 40–45 minutes, including the selected readings and video excerpts.
1. Ask what each metric measures—and when
Reported revenue answers an accounting question: how much the company recognized during a period? An operating metric may instead describe a stock at period-end, such as contracted work remaining, or an activity during the period, such as transactions processed. Putting them on the same chart without noticing the difference can create a false growth story.
The distinction is visible in this third-party visualization of a cybersecurity company’s Q4 FY25 results. Its quarterly subscription revenue is approximately billion, while annual recurring revenue (ARR) is shown as billion.
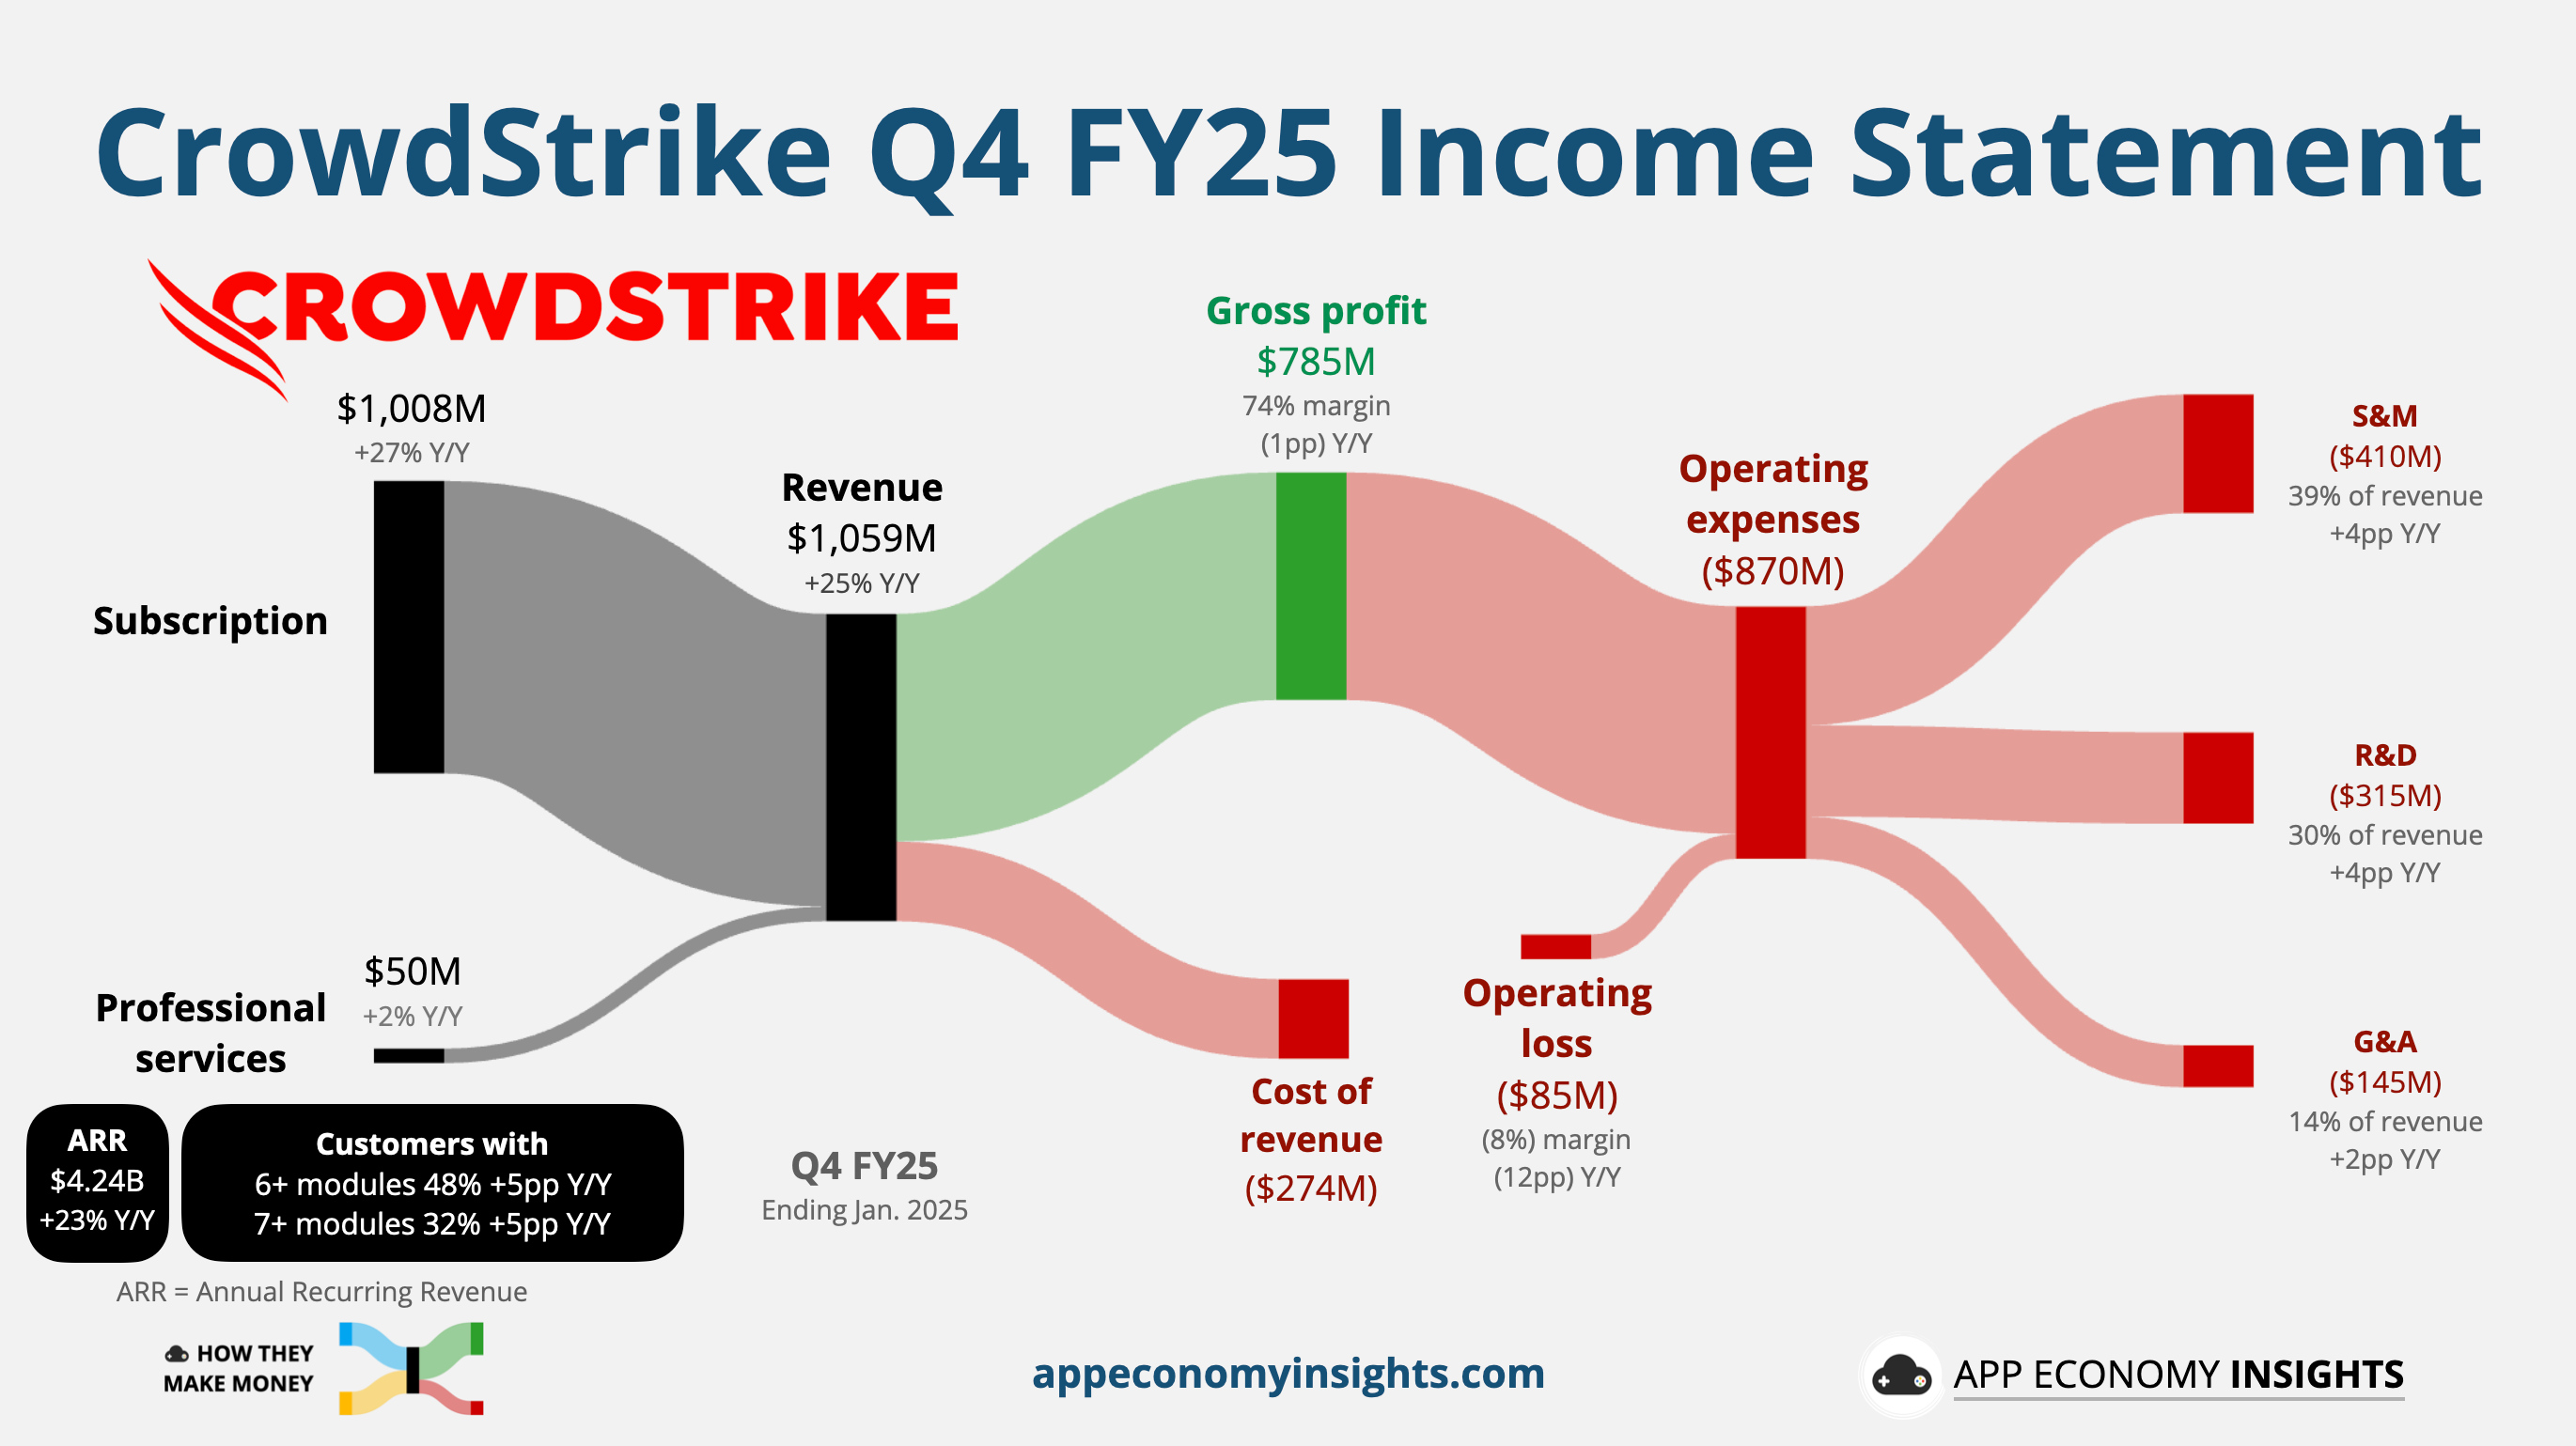
The ARR number is neither that quarter’s revenue nor necessarily next year’s revenue. It represents a defined run rate of recurring business at a point in time; the company’s precise definition matters. Some customers will expand, contract, or leave, and the revenue recognized in a future period will depend on those events and the applicable accounting rules.
Before interpreting any sector metric, establish four things:
- Definition: What is included and excluded?
- Time basis: Is it a period-end balance, a flow over a quarter, or an annualized rate?
- Economic link: How might it translate into recognized revenue, cost, or profit?
- Comparability: Has the definition, customer population, or reporting segment changed?
A metric can be useful without being a promise. It is most valuable when you can explain both what it reveals and what it cannot establish.
2. Read the enterprise-software signals as a system
For a subscription software business, three questions organize the operating disclosures: How much recurring business is in place? What are existing customers doing? What has been contracted for future delivery?
ARR commonly annualizes a defined set of active recurring contracts or subscriptions at a particular date. Net new ARR is the change in that balance between two dates; despite its name, it is net of additions, expansion, contraction, and lost business. ARR definitions vary, especially when contracts contain usage-based charges. Compare the definition and trend before treating two companies’ ARR as equivalent.
Net revenue retention (NRR) isolates the customers present at the start of a comparison period. In a simplified recurring-revenue formulation:
Revenue from new customers does not enter that cohort calculation. Gross revenue retention (GRR) excludes expansion from the numerator, exposing the revenue lost through contraction and churn. NRR above 100% therefore says that expansion from the starting cohort more than offset its losses; it does not say that no customers left.
Watch the selected excerpts of Net Revenue Retention for SaaS: Key Metric or Disguise for Disappointing Performance? from Mergers & Inquisitions / Breaking Into Wall Street. The important insight is not a target percentage, but why a single NRR figure can hide different underlying businesses.
Net Revenue Retention for SaaS: Key Metric or Disguise for Disappointing Performance?
Watch the selected excerpts to distinguish expansion from customer loss and to see why NRR needs a companion measure.
Start with the cohort definition, focusing on why new-customer revenue is excluded. Then watch identical NRR to see how different expansion and loss rates produce the same headline number. Finish with gross retention for the measure that removes expansion.
For example, two businesses can each report 105% NRR. One might lose 15% of starting revenue and gain 20% through expansion; the other might lose 5% and gain 10%. Their headline retention matches, but their dependence on upselling to replace lost revenue does not. If a filing supplies NRR but not its components or GRR, that distinction remains unobserved, not settled.
The contracted-work measure is remaining performance obligations (RPO): revenue allocated to obligations the company has not yet fulfilled. Current RPO (cRPO) is the portion expected to be recognized over roughly the next 12 months. RPO may include both amounts already billed but not recognized and contracted amounts not yet billed. It is not cash collected, and it is not a complete forecast: future renewals and some variable, uncommitted usage may not be represented. Longer contract durations can lift total RPO without proportionately improving the next year’s outlook.
ServiceNow’s Q1 2024 release puts these measures beside recognized revenue and margins. Read the selected tables and commentary in ServiceNow Reports First Quarter 2024 Financial Results from its newsroom.
ServiceNow Reports First Quarter 2024 Financial Results - ServiceNow Newsroom
Read the financial-results table as a compact case study in recognized revenue, contracted work, and differing profit measures. Then read management’s explanation of a cRPO growth distortion.
In “First Quarter 2024 GAAP Results,” read the results table, from the subscription-revenues row through the free-cash-flow row; compare the GAAP and non-GAAP columns rather than combining them. Under “Financial Outlook,” read the paragraph immediately before the second-quarter guidance table. In particular, the contract-term explanation identifies a reason cRPO growth can change without an equivalent change in customer demand. Finally, under “Statement Regarding Use of Non-GAAP Financial Measures,” read the comparability warning.
In that quarter, ServiceNow reported billion of GAAP subscription revenue, billion of GAAP cRPO, and billion of GAAP total RPO. These are not three versions of the same revenue figure. Subscription revenue was recognized in the quarter; cRPO and RPO were balances at the reporting date with different expected recognition horizons. Their respective year-over-year growth rates—25%, 21%, and 26%—should be read with those time bases in mind.
The release also explains that a higher mix of 12-month renewal terms in a public-sector business was expected to reduce the following quarter’s cRPO growth by two percentage points. A shorter term can reduce the amount visible in contracted balances even if the customer is expected to renew. That expectation is relevant context, but it is not the same thing as a signed renewal. The appropriate interpretation is a hypothesis to monitor: Is cRPO slowing because demand weakened, or because contract timing and duration changed?
Profit measures require the same discipline. ServiceNow reported about 83% GAAP subscription gross margin, 13% GAAP operating margin, and 30% non-GAAP operating margin for Q1 2024. Gross margin tests delivery economics before operating expenses; operating margin includes those expenses. The non-GAAP operating measure applies adjustments and is not interchangeable with the GAAP result. The quarter’s 47% free-cash-flow margin describes cash generation under the company’s non-GAAP definition for that quarter; billing and collection timing can make a single quarter unrepresentative of a full year.
3. Let a diversified company’s definitions prevent false comparisons
A diversified company may disclose a cloud growth rate, a seat-growth rate, and a segment operating margin without disclosing the standalone profit of the cloud service you want to analyze. Microsoft’s FY2025 annual report is useful because it defines its metrics and discusses the businesses within its reporting segments.
Read the metric definitions before reading the growth commentary. Notice which measures describe a customer count, which describe revenue growth, and which aggregate several businesses.
In “Metrics,” begin at the commercial definitions, stopping after “Azure and other cloud services revenue growth.” Continue through the “More Personal Computing” metric definitions, from consumer metrics. Then, in “Segment Results of Operations,” read the FY2025 discussion of “Productivity and Business Processes” from cloud and seats. In “Intelligent Cloud,” find Azure growth and the later sentence from margin drivers.
Microsoft reports 15% Microsoft 365 Commercial cloud revenue growth and 6% Commercial seat growth in FY2025, citing revenue-per-user growth as well. That supports a conclusion that more than seat additions contributed to cloud revenue growth. It does not permit a precise price calculation: revenue is earned throughout the year, while disclosed seats are counted at period-end, and changes in product mix can affect revenue per user.
Likewise, the report says Azure and other cloud services revenue grew 34%. Its definition includes services beyond Azure infrastructure. Intelligent Cloud is a still broader reporting segment. Neither the segment’s revenue nor its operating margin can simply be labeled “Azure revenue” or “Azure margin.” The report’s discussion of AI-infrastructure scaling and efficiency gains helps explain margin pressure, but does not allocate the costs to a standalone Azure profit figure.
The annual report also reports search-and-news advertising growth both including and excluding traffic acquisition costs (TAC). These answer different questions about advertising economics. A faster ex-TAC growth rate than reported advertising-revenue growth is a clue to investigate traffic sources and payments to partners; by itself, it does not establish that every ad became more profitable.
Accounting policy closes the loop between commercial activity and reported revenue. Read the short portions of the same annual report that explain why a signed agreement, a billed amount, and recognized revenue can occur at different times.
Read the revenue-recognition policy to understand the conversion from software licenses and cloud usage into reported revenue.
In the Notes to Financial Statements, under “Revenue” and then “Revenue Recognition,” read the “Nature of Products and Services” paragraphs from licenses and cloud services. Near the end of that section, under “Contract Balances and Other Receivables,” read from billing versus revenue. Focus on the contrast between upfront license recognition, subscription revenue recognized over a contract period, and consumption revenue recognized with utilization.
This is why an operating disclosure needs an accounting bridge. An additional cloud commitment can increase contracted obligations before revenue is recognized. An increase in consumption can raise recognized revenue as customers use resources, without a proportionate increase in subscription-style ARR. An invoice can create deferred revenue rather than immediate recognized revenue. None of these differences implies that one measure is defective; they measure different stages of commercial activity.
4. Change the metric set when the business model changes
The software metrics above cannot be copied wholesale onto a marketplace, advertising platform, payments provider, or AI-infrastructure business. Across the sector, choose metrics that connect customer activity, monetization, and the cost of serving that activity.
| Business model | Activity signal to seek | Monetization or capacity signal | Interpretation trap |
|---|---|---|---|
| Enterprise SaaS | Paid seats, customers, or usage | ARR, retention, RPO, revenue per user | Treating annualized ARR or total RPO as next-year revenue |
| Cloud infrastructure | Workload consumption and customer commitments | Cloud revenue growth, gross margin, capacity investment | Treating a broad cloud segment’s margin as the margin of one service |
| Advertising platform | Audience engagement, searches, or ad impressions | Advertising revenue, revenue per search or user, TAC | Assuming more users or searches necessarily means more valuable ads |
| Marketplace | Orders or gross merchandise value (GMV) | Net revenue, effective take rate, seller services | Calling GMV company revenue, or overlooking returns and fulfillment costs |
| Payments platform | Transactions or total payment volume | Net revenue, fees, authorization performance | Treating processed value—or pass-through fees—as retained revenue |
| AI-native application or compute provider | Paid usage, tokens, requests, or capacity consumed | Recurring contracts or usage revenue, serving cost, utilization | Treating a recent usage run rate as committed, durable revenue |
These are questions to pursue, not a claim that every public company discloses every metric. For a marketplace, an apparent rise in take rate might reflect more seller-service revenue rather than a higher commission on identical transactions. For payments, payment volume can grow while revenue yield changes because of geography, merchant mix, or the mix of services provided. For an AI application, rapidly growing requests may be encouraging while retention and the cost of serving each request remain unclear. In each case, the metric’s denominator and scope determine its meaning.
A practical way to read an earnings pack is to write a brief metric note for each important number: its exact company definition; reporting period and comparison period; whether it is audited financial information or a company-defined operating measure; its plausible revenue or profit link; and the most important alternative explanation. If management changes a definition or stops disclosing a metric, record the change rather than joining the old and new series silently. A missing measure creates an evidence gap, not proof of either strength or weakness.
That habit turns disclosures into a usable industry viewpoint. Instead of saying “cloud demand is strong because a segment grew,” you can say which cloud measure grew, what businesses it includes, what happened to the relevant margin, and what remains undisclosed.
Conclusion
Sector metrics are valuable because they expose different parts of an economic engine: recurring business in place, existing-customer behavior, contracted future delivery, activity volume, monetization, and capacity or delivery cost. Interpret each according to its definition and time basis, reconcile it to recognized revenue where possible, and resist assigning a broad segment’s economics to a narrower product.
The next lesson uses these measures to evaluate unit economics—whether growth in the activity a company reports can generate attractive profit after the costs required to acquire and serve it.