Recommended resources
The freely available resources this lesson will direct you to.
- PM School - Defining Success Metrics for a product | Solving Metrics Questions in PM interviewswww.youtube.com
- Hypothesis testing with Applications in Data Sciencewww.youtube.com
- Patterns of Trustworthy Experimentation: Pre-Experiment Stage - Microsoft Researchwww.microsoft.com
- van den Akker 2020 Preregistration of Secondary Data Analysis - A template and tutorial.pdffiles.de-1.osf.io
Hello! Last time, you worked backward from a delivery question to the fields needed to answer it. Now you can make the question more useful: What result do you expect, and what result would change a decision?
This lesson shows how to write a hypothesis that the available data could challenge, then set success criteria before seeing the results. We will keep using the two-day delivery example, while distinguishing a hypothesis about an existing pattern from one about the effect of a proposed change.
From a question to a testable claim
Recall the analytical question: Over the last eight completed weeks, which fulfillment locations had a higher weekly late-delivery rate than the service overall, and how many eligible two-day orders were due at each location?
That question specifies an output, but not what size or persistence of a gap matters. “Some locations perform poorly” is a weak hypothesis: poorly has no agreed meaning, and almost any result could be made to fit it. A testable version names the population, comparison, metric, direction, and time window:
Among genuine, dispatched two-day orders due in the last eight completed weeks, at least one sufficiently busy location had a weekly late-delivery rate at least 2 percentage points above the service-wide rate in at least six of those weeks.
This is a descriptive hypothesis about a measurable pattern. It does not say that the location causes late deliveries. Order mix, routes, and other factors could contribute to the gap.
The Microsoft Research article Patterns of Trustworthy Experimentation: Pre-Experiment Stage gives a compact standard for hypothesis writing. Although its setting is A/B testing, its requirement that a claim be measurable and falsifiable also applies to this analysis.
Patterns of Trustworthy Experimentation: Pre-Experiment Stage - Microsoft Research
Read Microsoft Research’s guidance to see why a hypothesis and its metrics must be designed together.
Under “Forming a Hypothesis and Selecting Users,” find “Formulate your Hypothesis and Success Metrics.” Read the hypothesis guidance, then continue into the next paragraph, from “Choosing the right set of metrics for the experiment” through “regardless of which feature we are testing on.” Focus on falsifiability and on why a primary metric may need guardrails. Stop before the discussion of statistical power and “Choose the Appropriate Unit of Randomization”; those design details come later in the course.
A practical drafting pattern is: For this population and period, we expect this metric to differ from that comparator by this direction and amount, for this stated reason. The reason is worth recording even when it cannot yet be verified. Here, a plausible rationale might be that a persistent gap points to a location-specific process worth investigating. That rationale is not itself proof of the process.
The 2-percentage-point threshold and six-of-eight-week requirement are illustrative decisions, not universal rules. They should be agreed with the stakeholder before inspecting location results. If the team changes them afterward to highlight a preferred finding, the analysis no longer offers a fair test of its original claim.
Define what would count as support
A hypothesis becomes operational when someone else can apply its decision rule to the same data and reach the same classification. Let be location ’s late rate in week , and the rate among all eligible orders due service-wide in that same week. The weekly gap is:
A gap of is 2 percentage points: for example, 8% late versus 6% late. It is not a 2% relative increase.
For this analysis, we could agree on the following criteria:
| Criterion | Rule agreed before analysis |
|---|---|
| Primary evidence | Flag a location if is at least in at least six of the eight completed weeks. |
| Minimum volume | Apply that rule only to locations with at least 200 eligible orders due in each of the eight weeks. Show lower-volume locations separately as not assessed by this rule. |
| Comparison | Calculate each week’s service-wide rate from all eligible orders due that week, including orders at the location being assessed. Do not average location rates to obtain it. |
| Data readiness | Require a resolvable full-delivery status for at least 99% of eligible orders and location attribution for at least 99%. If a check fails, label the affected conclusion inconclusive, not successful or unsuccessful. |
| Decision | Investigate flagged locations’ operational drivers. Do not describe the observed gap as proof that the location itself caused lateness. |
These cutoffs are examples of success criteria for the analysis: rules for deciding whether the proposed pattern has enough measured support to warrant a follow-up. They are not a target that declares the delivery service successful. The count of 200 is a practical screen against highly volatile small groups, not a statistical guarantee.
The previous lesson’s definitions still govern every row: the deadline determines the reporting week, a late order has not been fully delivered by that deadline, and an absent delivery timestamp must not be mistaken for a verified non-delivery. Fix the reporting time zone, week boundaries, and data-as-of time as well. Otherwise, two analysts could implement the same-looking criterion and obtain different answers.
If no location meets the rule, the stated hypothesis is not supported by these eight weeks. That does not prove that all locations perform equally, or that a gap will never appear. Conversely, a flagged location warrants investigation; the threshold alone does not identify the cause.
Choose a primary metric without losing sight of the business outcome
A primary metric makes the decision legible. Guardrail metrics help catch ways that improving it could make the broader outcome worse. The measurement framework below illustrates that distinction in an online-purchase example: it connects a business objective and test hypothesis to an order metric, while monitoring revenue and average order value.
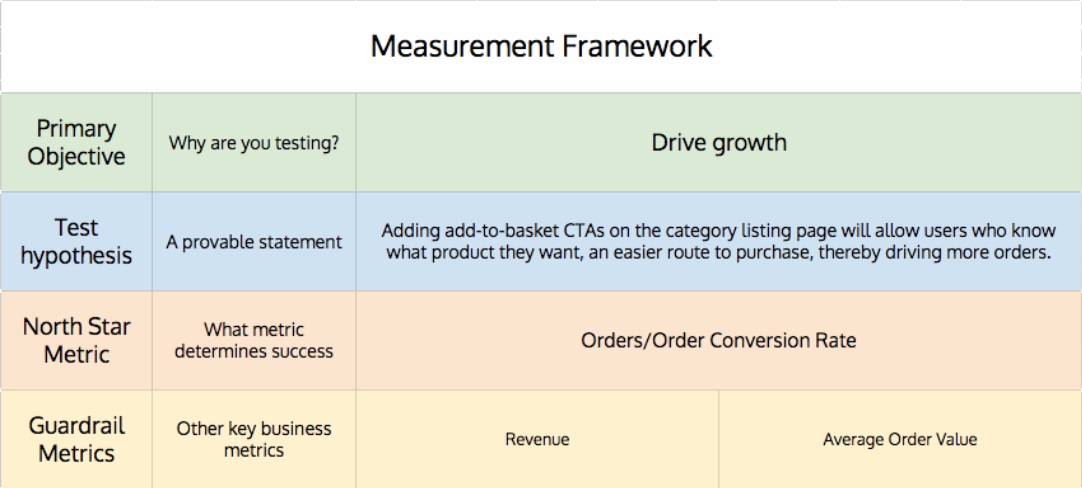
The image concerns a proposed change. Our location analysis instead asks whether an existing pattern is present, so its immediate safeguards are chiefly data-quality and interpretation checks. If the follow-up decision becomes “introduce a new dispatch alert to reduce lateness,” the criteria need to address possible side effects too. A team might then designate late-delivery rate as the primary outcome and set a maximum acceptable increase in support cost per eligible order as a guardrail.
In this short excerpt from PM School – Defining Success Metrics for a Product by PM School by NextLeap, notice how a rate can improve while the underlying volume moves in an unwanted direction.
PM School - Defining Success Metrics for a product | Solving Metrics Questions in PM interviews
Watch for the distinction between a metric and a goal, then for the reason to pair a primary rate with a counter-metric.
Watch metric versus goal for the target-and-deadline distinction. Then skip to guardrail example: registration rate rises even as the number of registrations falls. Relate that risk to your own denominator and to what a stakeholder ultimately wants to improve.
A useful way to review any proposed success criterion is to ask: Could we meet this threshold while making the actual decision worse? If so, revise the primary metric, add a relevant guardrail, or both.
Match the strength of the claim to the analysis
The wording of a hypothesis determines what evidence can support it. Compare these two claims:
- Pattern claim: “A location’s late rate exceeds the service-wide rate under the agreed rule.” Historical order data can assess this, subject to its definitions and quality.
- Impact claim: “Introducing a dispatch alert will reduce the late-delivery rate by at least 2 percentage points.” Historical location differences alone cannot establish this. The claim requires a credible comparison of outcomes with and without the alert.
The distinction matters in analytics interviews and project briefs. A precise threshold cannot rescue an unsupported causal claim. If you have only the eight-week location report, a defensible recommendation is to investigate a persistent gap—not to promise that a particular intervention will remove it. Later, you will study experimental design and statistical evidence for evaluating interventions.
Not every analysis needs a formal null hypothesis or a -value. The location rule above is a prespecified descriptive screen for deciding where to investigate. If the task instead requires an inferential claim about a wider population or an intervention’s effect, specify in advance what effect size and uncertainty would justify that claim. The preregistration tutorial’s Q22 shows why inference criteria should be set before results are known.
van den Akker 2020 Preregistration of Secondary Data Analysis - A template and tutorial.pdf
Read Q22 of the tutorial by van den Akker and colleagues as an example of recording evidence thresholds in advance. Its research topic differs from delivery operations; focus on the planning method, not its numerical cutoffs.
Go to Q22, “What criteria will you use to make inferences?”, around printed pages 30–31. Read the question and worked criteria, then the following “Comment(s)” paragraph beginning “It is crucial to specify your inference criteria before running a statistical analysis” and ending with its warning about moving the goalposts. Notice how it states both an effect-size requirement and an evidence rule before interpreting results. Stop before Q23.
For your own work, keep three questions distinct: What result would support the hypothesis? Is the data adequate to assess it? What action, if any, does that result justify? A “yes” to the first cannot compensate for a “no” to the second, and neither automatically settles the third.
Key takeaways
A testable hypothesis specifies who or what, when, which metric, compared with what, and the expected direction or threshold. Success criteria turn that claim into a rule fixed before results are viewed, with explicit data-readiness checks and an appropriately limited decision. Keep descriptive patterns separate from causal effects, and use guardrails when a primary metric could improve at the expense of the broader objective.
Next, you will document an analytics request’s scope, assumptions, risks, and limitations—including the qualifications that keep a well-written hypothesis from being overinterpreted.