Recommended resources
The freely available resources this lesson will direct you to.
Hello! This module examines where genetic changes come from, how they can spread through populations, and how people can investigate or use them. The first step is learning to read a representation of change: is it showing altered DNA bases, a rearranged chromosome, an abnormal number of one chromosome, or a change in whole chromosome sets?
You have already encountered DNA, genes and chromosomes in the heredity module. Here, the focus shifts from how genetic information is passed on to what, precisely, has changed. That distinction will help you give specific explanations in HSC Biology rather than calling every alteration simply “a mutation”.
Start with the scale of the representation
A gene is a stretch of DNA with a biological function. A chromosome is a long DNA molecule packaged with proteins and containing many genes. The genome is an organism’s complete genetic material. These are connected, but they are not interchangeable units.
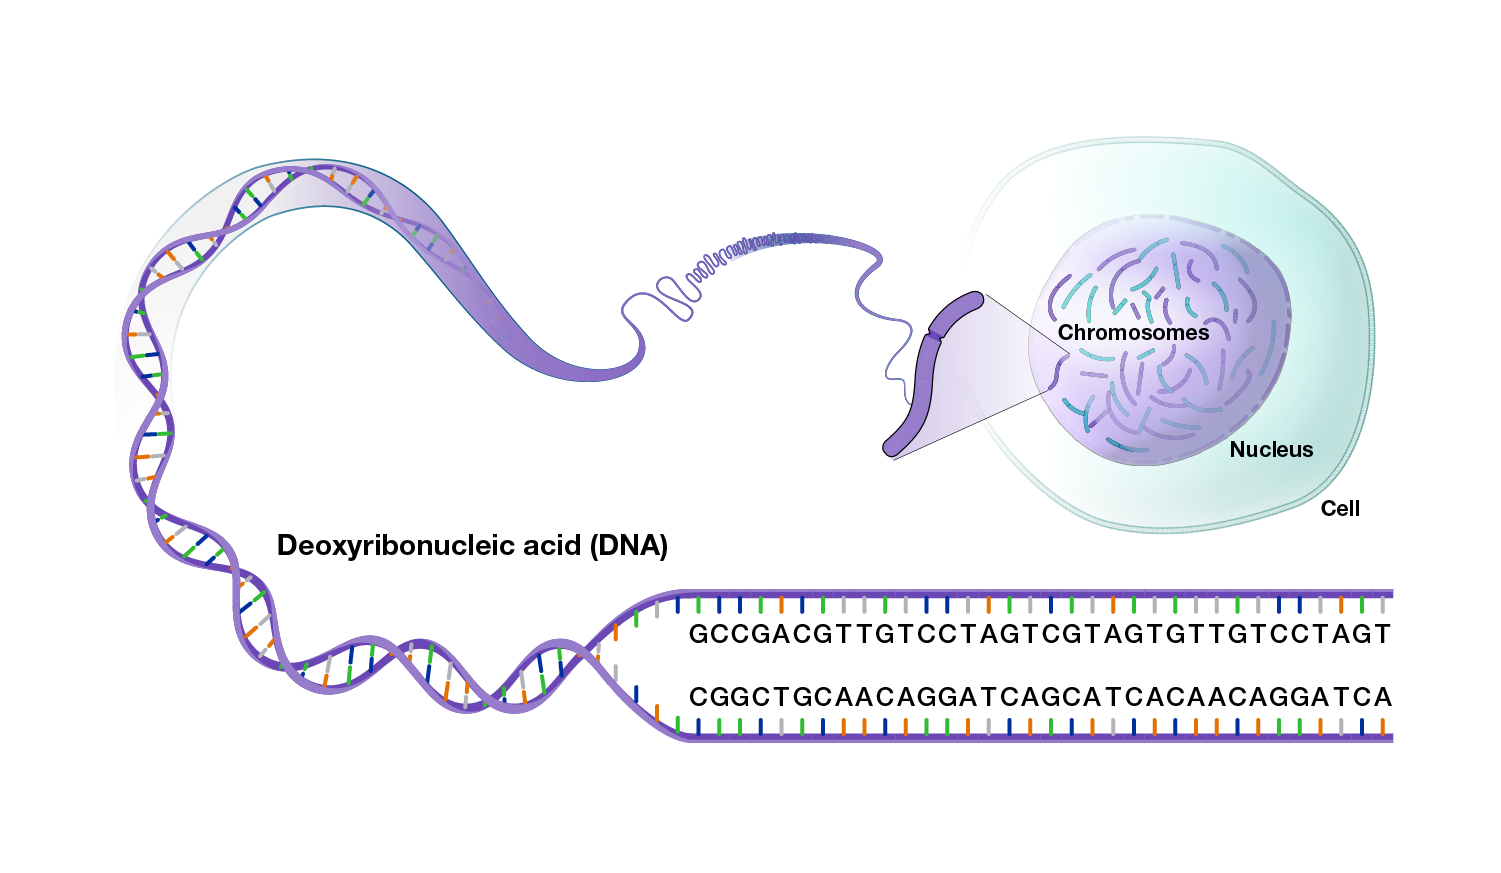
A mutation is a lasting change in genetic material. To classify one from a diagram, compare the before and after states and ask what unit has changed. A few letters in a DNA sequence point to a different scale from a large coloured block on a chromosome. A chromosome count requires a different comparison again: you must check whether the difference affects one chromosome type or every type.
The representation also has limits. A short DNA sequence does not, by itself, tell you whether it lies inside a gene. Likewise, seeing an extra copy of one gene does not, by itself, tell you whether a few bases or a large chromosome segment were duplicated. Use the labels and scale supplied, rather than inferring more than the diagram shows.
Gene mutations: changes within a gene’s DNA sequence
A gene mutation changes the base sequence within a gene. A substitution replaces a base; an insertion adds one or more bases; a deletion removes them. In a sequence diagram, you identify these by aligning the before and after letters.
Watch the gene-mutation portion of Mutations (Updated) by Amoeba Sisters. Its moving sequence diagrams make the units of change particularly clear.
In Mutations (Updated), Amoeba Sisters shows how substitutions, insertions and deletions appear in DNA sequences.
Watch gene mutations. Follow the before-and-after bases, especially the single-base insertion. Notice that a change in a gene's DNA does not automatically specify what effect, if any, an organism will show.
For example, compare ATGCAATTT with ATGCTATTT. The sequences are the same length, and one base has been replaced. If this stretch is within a gene, it is a gene-level substitution. If a base is added to or removed from a gene’s sequence, it is a gene-level insertion or deletion. Such a change can shift how subsequent bases are grouped into triplets during protein production, but not every insertion or deletion causes a frameshift.
The word insertion alone therefore does not tell you the mutation’s scale. You need to know what was inserted and where. A single added base in a gene is different from a chromosome segment containing many genes being inserted into another chromosome.
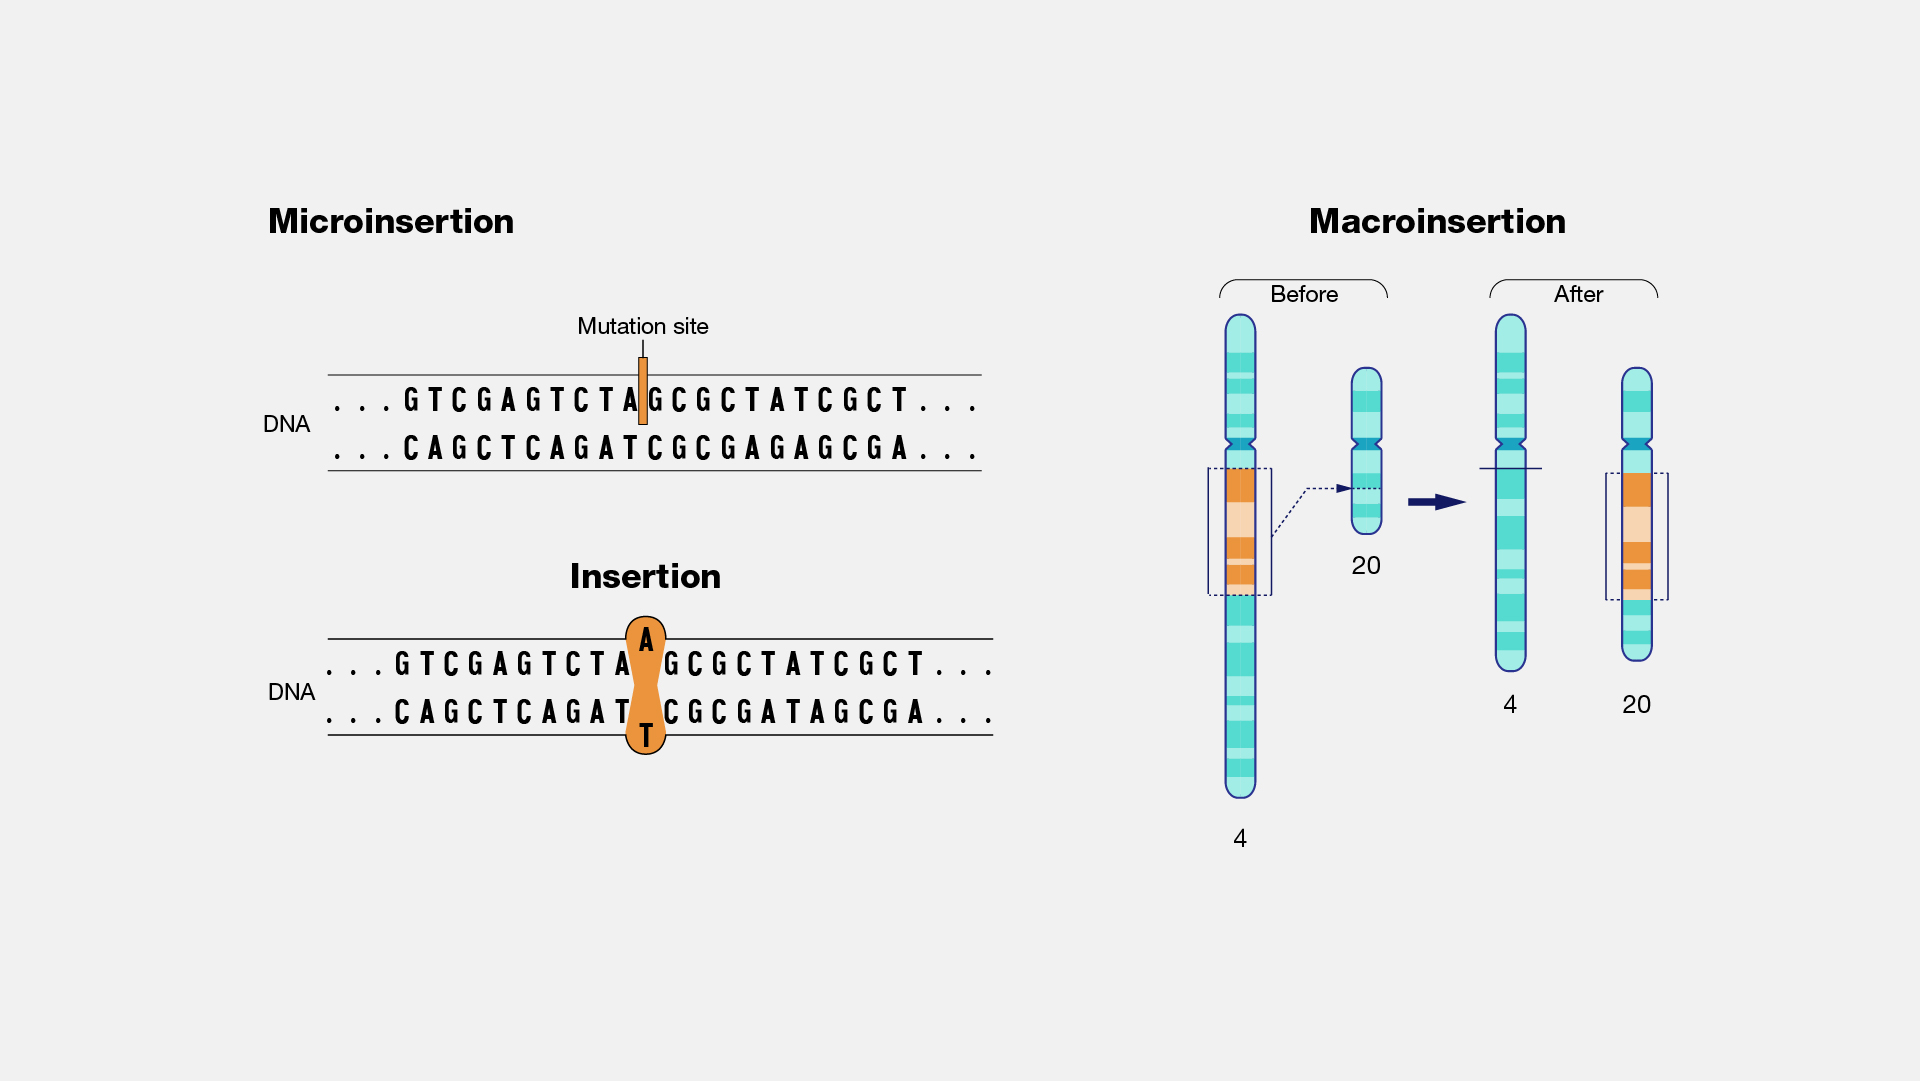
In the left-hand image, the inserted A–T base pair is visible among individual DNA bases. It would be a gene mutation if the insertion occurred within a gene; the image does not establish that location on its own. Keep that qualification in mind when interpreting unfamiliar diagrams.
Chromosome mutations: changes to a chromosome’s structure or count
A structural chromosome mutation changes the arrangement or amount of a chromosome segment. Such segments may contain multiple genes. Common representations show a segment:
- deleted: missing from a chromosome;
- duplicated: present in an additional copy;
- inverted: reattached in the opposite orientation;
- translocated: moved to a different chromosome.
Return to the Amoeba Sisters video for its chromosome-scale diagrams.
The next part of Mutations (Updated) shifts from individual DNA bases to changes involving chromosomes and their segments.
Watch chromosome changes. Focus on how a deletion, duplication, inversion or translocation would look when chromosomes are drawn as coloured segments. The final portion introduces a failure of chromosomes to separate, which changes chromosome count rather than segment arrangement.
On the right-hand side of the Microinsertion and macroinsertion image, a highlighted segment moves from chromosome 4 to chromosome 20. You cannot meaningfully describe that picture as “one extra base”. It depicts a chromosome-level structural change, even though the destination chromosome has gained an insertion. The chromosome numbers label the chromosomes involved; they do not mean the cell has gained 16 chromosomes.
Chromosome mutations can also involve the number of an individual chromosome type. If a diagram shows three copies of chromosome 21 where the reference cell has two, it shows trisomy 21: one chromosome type has an extra copy. If one copy is present where there would normally be two, that is monosomy. The key visual clue is that the imbalance concerns a particular chromosome, not one additional copy of every chromosome.
This is why it helps to separate two questions: “Has a chromosome’s structure changed?” and “Has the number of a chromosome changed?” They are distinct observations, although both may be discussed under chromosomal changes.
Genome-level changes: whole chromosome sets
To distinguish one extra chromosome from an extra set, first establish what a set is. A complete chromosome set contains one of each chromosome type. A cell with two complete sets has two of each type; a cell with three complete sets has three of each type. A change involving complete sets is a genome-level change in ploidy. More than two complete sets is called polyploidy.
Read the short foundational passage below before comparing the count diagrams.
1.10: Ploidy- Polyploidy, Aneuploidy, and Haploidy - Biology LibreTexts
Biology LibreTexts defines ploidy in terms of complete chromosome sets. Read this to establish exactly what must be repeated before you classify a diagram as polyploid.
Under "Concepts for Polyploidy", read the "Ploidy" and "Polyploid" subsections. Start at the sentence defining ploidy and continue through the explanation of a complete set: complete sets. Use the ploidy table as a quick visual reference. Stop before "Several symbols are used as shorthand"; the later specialist notation is not needed here.
Now imagine a simplified organism with just three chromosome types, labelled A, B and C. These labels identify types, not identical DNA sequences:
| Representation | What the count shows | Classification |
|---|---|---|
AA BB CC |
Two complete sets | Reference diploid cell |
AAA BB CC |
One additional A; B and C are unchanged | Trisomy: an individual chromosome-number change |
AAA BBB CCC |
One additional copy of every chromosome type | Triploidy: a genome-level, whole-set change |
Both altered cells have more chromosomes than the reference cell, but “more chromosomes” is not a sufficiently precise answer. The second row has an uneven set; the third has three complete sets.
For a visual comparison, watch these portions of Alteration of Chromosome Number and Structure by Professor Dave Explains.
Alteration of Chromosome Number and Structure
In Alteration of Chromosome Number and Structure, Professor Dave Explains contrasts changes in an individual chromosome's count with changes in complete chromosome sets.
Watch individual counts for the diagrams showing how a cell can end up with an extra or missing chromosome. Then watch whole sets for polyploidy. As you watch, track whether the discrepancy affects one chromosome type or the entire collection.
A terminology caution for exam responses: classifications sometimes overlap. An abnormal chromosome count affects the genome in an everyday sense, and some sources group all numerical changes under “genome mutations”. For a three-scale distinction, the useful convention is to identify which unit is numerically altered: trisomy changes the count of one chromosome type; polyploidy changes the number of complete sets. If a question supplies its own classification scheme, use that scheme and describe the actual change so your meaning remains unambiguous.
Turning a diagram into a precise explanation
An HSC response is stronger when it names both the scale and the evidence visible in the representation. You can build that explanation in three moves:
- Identify the units pictured: individual bases, chromosome segments, individual chromosomes, or complete sets.
- Compare before and after: what was replaced, added, removed, reversed or moved?
- State the classification at the most specific scale the evidence supports.
For instance, if a figure shows one coloured band reversed on an otherwise intact chromosome, an explanation is: “This is a structural chromosome mutation—an inversion—because a chromosome segment appears in the opposite orientation.” If it shows three copies of every chromosome type rather than two, the decisive evidence is the repeated complete set, not merely a higher total count.
Resist two tempting shortcuts. First, do not classify by the action word alone: deletion could refer to a base or to a substantial chromosome segment. Second, do not claim a protein change, disease or benefit from a before-and-after diagram that shows only DNA or chromosomes. Those effects require further evidence and will be examined later in the module.
Key takeaways
A gene mutation alters a gene’s base sequence. A structural chromosome mutation alters the arrangement or amount of a chromosome segment; an individual chromosome-number change adds or removes copies of a particular chromosome. A whole-set genome change alters how many complete chromosome sets are present. In every case, classify the mutation from the unit shown changing, and state what the representation does—and does not—establish.
Next, you will examine how a specified mutagen can make mutations more frequent. This lesson’s scale distinctions will help you describe exactly what kind of genetic change the evidence reveals.