Recommended resources
The freely available resources this lesson will direct you to.
- Correlation vs Causation: A Brief Guide To Communicating Researchwww.youtube.com
- How to Research Stockswww.youtube.com
- Financial Modeling Assumptions Explained and How to Use Them | CFIcorporatefinanceinstitute.com
- A Layman's Guide to Separating Causation from Correlation ... and Noticing When Claims of Causality are Invalid - Alex Edmansalexedmans.com
Hello! Last time, you built a peer benchmark and found that an illustrative company’s 18% operating margin exceeded a 13% peer median. The arithmetic tells you what differs. It does not, by itself, tell you why—or whether the difference will persist.
That gap between a number and a conclusion is the focus today. You will learn to label five kinds of statement—verified observation, calculated estimate, interpretation, causal claim, and unsupported opinion—and to write each at the strength the evidence permits. This will make your company brief easier to trust and easier to defend in an interview. Allow about 35–40 minutes; you can split the reading and the claim-audit workflow across two 30-minute study sessions.
Give every sentence an evidence label
Consider these statements about a fictional company:
| Statement | Primary label | What supports it? |
|---|---|---|
| “The company reported revenue of 100 in its annual report.” | Verified observation | The relevant report, period, unit, and page |
| “Revenue grew 11% from 90 to 100.” | Calculated estimate—more precisely, a derived historical figure | The two sourced inputs and a reproducible formula |
| “The growth suggests demand remained resilient.” | Interpretation | The growth figure, plus context such as customer or market evidence |
| “A product launch caused the revenue increase.” | Causal claim | Evidence isolating the launch’s effect from other possible drivers |
| “This is clearly the sector’s best business.” | Unsupported opinion, unless substantially developed | Defined criteria, comparable evidence, and acknowledged limitations are missing |
These are labels for the work a sentence does, not permanent labels for a number. A calculated figure can be sound while an interpretation built on it is weak. A causal claim can also be an unsupported opinion if it has no adequate evidence.
A verified observation means you checked that a suitable source says or shows what you attribute to it. It does not mean you independently proved the company’s underlying accounts. Write “the company reported” when your evidence is its disclosure; distinguish that from “we independently confirmed.” Record whether a figure is consolidated or standalone, the reporting period, currency, units, and whether the source calls it actual, guidance, or forecast. A quotation from management is an observation about what management said, not automatic verification of the prediction in that quotation.
A calculated estimate needs a further distinction. Historical arithmetic, such as a margin calculated from reported revenue and profit, is a derived historical metric. A future margin produced by applying an assumed growth rate is a forecast estimate. Both should show their inputs and method, but the latter also needs assumptions and uncertainty. Do not let a clean formula make a forecast look like a reported fact.
Read the historical-data subsection of CFI’s Financial Modeling Assumptions Explained and How to Use Them for that boundary between disclosed performance and a forecast built from it.
Financial Modeling Assumptions Explained and How to Use Them | CFI
CFI explains how historical statements provide a baseline without dictating next year’s result.
Under “How to Create Reliable Assumptions,” find “1. Historical Data: Learning From Past Performance.” Begin where the text says “Analyzing past performance helps establish trends and benchmarks.” Read the historical-data discussion through the example that proposes a next-year growth assumption. Notice where the author moves from reported history and calculated metrics to a proposed future rate.
An actual, a calculation, and a forecast are not interchangeable
The spreadsheet image below is an illustration of labels, not a primary company filing. It shows an income statement in USD thousands with columns marked A for historical actuals and F for forecasts.
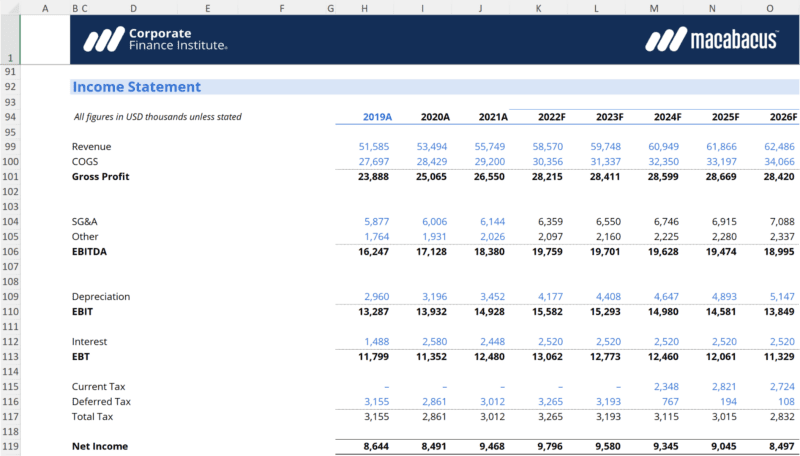
The image displays revenue of 55,749 for 2021A and 58,570 for 2022F. From the image, you can verify that those entries appear in the illustration. You cannot use it to claim that an identified company earned either amount, or that the 2022 forecast was subsequently achieved.
The implied forecast growth is approximately:
“Revenue is forecast to grow by approximately 5.1%” describes the calculation appropriately. “Revenue grew by 5.1% in 2022” incorrectly converts a forecast into an actual result. Even if the spreadsheet calculation is exact, the business outcome remains uncertain.
For your own brief, use a compact trail: source figure and period; formula; resulting metric; analytical meaning; limitation. For example, the previous lesson’s fictional benchmark supports “18% is 5 percentage points above the six-peer median of 13%.” It does not yet support “the company has superior management.”
Interpret differences without inventing their cause
An interpretation offers a reasoned meaning for observations. It is valuable—research would be little more than tables without it—but should remain distinguishable from the observations themselves.
Suppose the fictional company’s margin exceeds the peer median. Several explanations could fit: a higher-margin product mix, more favorable pricing, lower operating costs, an unusual accounting item, or differences in what the peers include in operating profit. “The margin premium may reflect product mix” is a hypothesis. Segment disclosures and comparable metric definitions might strengthen it; contradictory evidence might weaken it. “The margin premium proves superior pricing power” goes further than the benchmark allows.
A causal claim says that changing one factor produced a change in another. Words such as caused, drove, boosted, and reduced deserve particular scrutiny. Timing and association alone are insufficient. If margins rose after a new product launched, the launch might have helped—but input costs may also have fallen, older products may have changed mix, or competitors may have raised prices. Even management’s explanation is evidence of its view, not necessarily an isolated measurement of the launch’s effect.
Watch the Winton Centre’s Correlation vs Causation: A Brief Guide To Communicating Research. Its examples show how easily a report’s careful language can become an unjustified causal headline.
Correlation vs Causation: A Brief Guide To Communicating Research
The Winton Centre demonstrates the difference between an observed association and a claim about what produced it, then offers practical wording choices.
Watch the opening example for a shared factor behind two moving variables. Continue through the headline shift, noticing each increase in certainty. Finish with causal wording: listen for the distinction between “associated with” and “raises” or “reduces.”
The video uses controlled experiments to clarify the strongest case for causal inference. Business research is often observational, but that does not make all causal investigation impossible. It means you must examine alternative explanations and match your wording to the strength of the evidence. Alex Edmans’ A Layman’s Guide to Separating Causation from Correlation develops two especially useful checks: reverse causality (perhaps better performance enables an action, rather than the action improving performance) and omitted variables (perhaps a third factor influences both).
Alex Edmans uses business examples to show why an apparent relationship may have more than one explanation, and how to discuss possible causes without overstating them.
At the beginning of the article, start with “You look at data from hundreds of metropolitan areas.” Read the opening and examples through the bullet about socially responsible firms; focus on its alternative explanations. Then skip the technical-method sections to “IV. An Alternative Technique: Common Sense.” Read the closing section, especially its warning that suggestive evidence is not clean proof.
In a first company brief, you will rarely isolate a cause conclusively. You can still do useful analytical work: state the proposed mechanism, look for evidence it predicts, seek a credible alternative explanation, and say what remains unknown. “Margins rose alongside a shift toward the higher-margin segment; the disclosures do not isolate the segment shift’s contribution” is more informative than either an unsupported “the shift drove margins” or a refusal to interpret anything.
Audit the claim before publishing it
Use a claim ledger beside your source register for the consequential sentences in your brief. A small spreadsheet is enough:
| Column | What to record |
|---|---|
| Claim as drafted | The exact sentence intended for the report or chart caption |
| Claim type | Observation, derived historical metric, forecast estimate, interpretation, or causal claim |
| Evidence | Source and location; for a calculation, input cells and formula |
| Alternative or limitation | A competing explanation, definition mismatch, missing disclosure, or forecast assumption |
| Publication wording | Keep, qualify, attribute, or remove |
Here is what an audit looks like for the fictional margin benchmark:
Draft: “The company’s superior management drove its 18% margin, beating peers by 5%.”
The draft mixes multiple errors. “Superior management” is an unsupported judgment; “drove” asserts causation; and 18% versus 13% is a 5-percentage-point difference, not an unqualified 5% difference. An evidence-matched version is:
Publishable wording: “The company’s 18% operating margin was 5 percentage points above the 13% median of six selected peers. The comparison does not establish whether management, business mix, accounting differences, or temporary factors explain the gap.”
The second sentence does not discard the finding. It tells a reader exactly where the calculation ends and further diligence begins.
Before retaining a consequential claim, check four things:
- Attribution: Does the cited source actually support the statement as written? Is a management forecast identified as such?
- Reproduction: Can someone recompute every derived figure from identified inputs, periods, units, and definitions?
- Inference: Does the conclusion require evidence beyond the numbers shown? If so, label it as an interpretation or investigate further.
- Language: Would replacing “caused” with “coincided with,” “is consistent with,” or “management attributes to” better match the evidence? These phrases are not interchangeable; choose the one that describes what you actually know.
This audit is especially useful for chart titles and executive summaries. Recruiters may read those before the methodology, so an overconfident headline cannot be rescued by a careful footnote several pages later.
Key takeaways
Observations report what a checked source shows. Calculated estimates expose their inputs and method, while distinguishing historical arithmetic from assumptions about the future. Interpretations explain what evidence might mean. Causal claims require a stronger account of alternative explanations. Unsupported opinions should be evidenced, qualified, or removed.
Your peer benchmark is now ready for a defensible sentence, not just a spreadsheet result. In the next lesson, you will choose charts that communicate such findings accurately; the claim in a chart’s title will need the same care as the numbers on its axes.