Recommended resources
The freely available resources this lesson will direct you to.
In our previous lesson, we delved into measuring the magnitude of market turbulence by engineering volatility features using GARCH models and realized volatility. We learned to quantify risk by looking at how much a time series fluctuates. Today, we will approach our signal from an entirely different and powerful perspective. Instead of just measuring the size of changes, we'll learn to decompose the signal itself into its fundamental building blocks, operating at different frequencies and at different moments in time.
This lesson introduces the wavelet transform, a mathematical tool that acts like a microscope for time series data. It allows us to see not only what frequencies are present in a signal (like short-term noise or long-term trends) but also precisely when they occur. For financial data, where market dynamics are non-stationary and events unfold across multiple time horizons, this is an exceptionally powerful capability. You'll learn how to apply these transforms and, most importantly, how to turn their output into highly informative features for your machine learning models.
The Limitation of a Frequency-Only View
Many signal processing techniques, such as the Fourier Transform, are designed to identify the frequency components of a signal. They answer the question: "What are the underlying rhythms or cycles in my data?" However, they do so at a cost: they lose all information about time.
To build a strong intuition for this limitation and to understand why wavelets are so revolutionary, let's start with a superb conceptual video.
Wavelets: a mathematical microscope
This video, "Wavelets: a mathematical microscope," provides a brilliant and intuitive explanation of the problem wavelets solve.
Please watch the segment from the introduction to the end of the traffic light example (Wavelet transform). Pay close attention to the traffic light analogy. It perfectly illustrates how the Fourier Transform can see which frequencies (colors) are present but is completely blind to when they occur, making it impossible to distinguish between a working, broken, or disastrously malfunctioning traffic light. This is the core problem that wavelets address for non-stationary signals like financial time series.
As the video highlights, financial time series are like the traffic light signal: the "frequencies" (market dynamics) are not constant. A high-frequency, noisy period might be followed by a calm, low-frequency trend. A Fourier Transform would average this out, but a wavelet transform can pinpoint each regime in both time and frequency.
The Wavelet: A Time-Frequency Microscope
The wavelet transform overcomes the limitations of the Fourier transform by using a different kind of analyzing function. Instead of the infinitely long sine and cosine waves, it uses a wavelet—a small, localized wave-like oscillation that has a beginning and an end. The name itself, from French, literally means "little wave."
The core idea of the wavelet transform is to take this "mother wavelet" and do two things:
- Scale it: Stretch it out to look for low-frequency phenomena and compress it to look for high-frequency events.
- Translate it: Slide it along the signal's time axis to see where these frequency events are located.
At each time point and for each scale, we measure how well the wavelet matches the signal. This measurement is essentially a convolution, or a sliding dot product. A high value means the signal has significant energy at that specific time and scale (frequency).
The following segment from the "Wavelets: a mathematical microscope" video provides an excellent visualization of this entire process.
Wavelets: a mathematical microscope
This part of the video explains what a wavelet is and how the transform process works mechanically.
First, watch the section that defines a wavelet (What is a wavelet?). Focus on the two key properties: it must have a zero mean and finite energy, which is what makes it localized in time. The video introduces the popular Morlet wavelet. Next, watch the detailed explanation of the transform process (The wavelet transform). This section visually demonstrates the concepts of the mother wavelet, scaling (the 'a' parameter), translation (the 'b' parameter), and how convolution is used as a measure of similarity. This is the mechanical heart of the transform.
The Scalogram: Visualizing Time and Frequency
The result of performing a Continuous Wavelet Transform (CWT) is a set of coefficients for every point in time and for every scale. We can visualize these coefficients as a 2D plot called a scalogram or time-frequency heatmap.
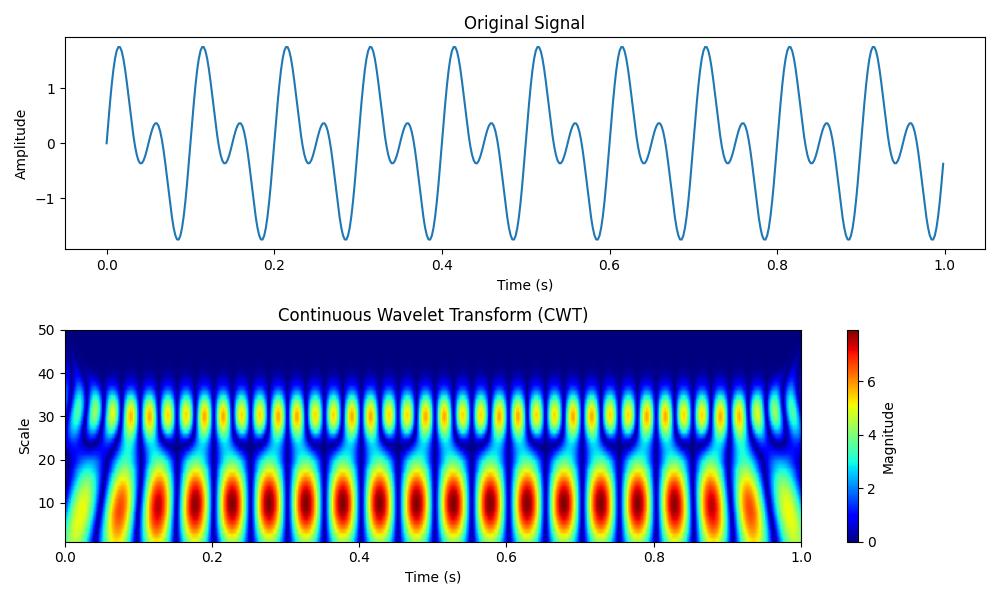
In this scalogram, you can clearly see how the signal's frequency content changes over time. The bright yellow bands at the bottom represent high-energy, high-frequency (low scale) oscillations that are persistent throughout the signal. This ability to resolve a signal in both time and frequency is what makes the wavelet transform so powerful for feature engineering.
From Transform to Features
Now for the crucial step: how do we convert these wavelet coefficients into features a machine learning model can use? There are two primary strategies, both of which are very powerful.
Strategy 1: The Scalogram as an Image for CNNs
This is a particularly elegant approach that leverages your background in computer vision. The 2D scalogram is, for all intents and purposes, an image. It's a 2D representation of a 1D time series. You can generate a scalogram for each time series instance in your dataset and use these images to train a Convolutional Neural Network (CNN).
The CNN will learn to detect patterns in the scalogram—such as specific shapes, textures, or localized bright spots—that are predictive of the target variable. This method automates the process of feature extraction from the time-frequency domain.

To see a practical application of this, let's look at a blog post that uses this exact technique for classifying ECG signals.
Extracting Features from ECG Time Series Using Fourier ...
This article provides a clear, practical walkthrough of creating scalograms from time series data and using them to train a CNN.
First, read the Introduction to understand the context. Then, skip the section on Fourier transforms and go directly to the section demonstrating the wavelet transform. Read about the application on ECG data and the creation of the scalogram. Finally, read the section on Training the classifier. This is the key part. It shows how the 2D scalogram images are used as inputs to a simple CNN, achieving high classification accuracy. This directly demonstrates the "out-of-the-box" method you were interested in.
Strategy 2: Statistical Features from Decomposition Levels
A more traditional, but still highly effective, approach is to extract statistical features from the wavelet coefficients at each scale. The wavelet transform decomposes the original signal into several new time series, one for each scale, representing different frequency bands (e.g., short-term details, medium-term components, long-term trends).
From each of these new time series (sub-bands), you can compute a battery of statistical features, such as:
- Mean
- Variance / Standard Deviation
- Skewness / Kurtosis
- Energy (, where are the coefficients)
- Entropy (a measure of complexity)
This process converts a single time series into a rich set of tabular features that can be used by any standard machine learning model like Gradient Boosting or a simple MLP.
Wavelet Transforms in Financial Time Series Analysis
This research paper discusses advanced applications of wavelets in finance. We will focus on the specific section that details feature engineering.
Please find the subsection 2.3.2. Feature Extraction and Engineering Using Wavelets. Read this short section (from the beginning). It describes exactly the strategy of calculating "a denser collection of statistics on the wavelet sub-bands than on mean, variance, energy, or entropy." This provides the theoretical basis for the second feature creation strategy.
Practical Implementation in Python
Implementing the CWT and generating scalograms in Python is straightforward with the PyWavelets library. The following video tutorial walks through the necessary code.
Continuous Wavelet Transform (CWT) of 1-D Signals using Python and MATLAB
This video, "Continuous Wavelet Transform (CWT) of 1-D Signals using Python and MATLAB," provides a concise and practical guide. We will focus only on the Python implementation.
Watch the segment covering the Python implementation. The key function to note is pywt.cwt(). The video shows how to define your signal, choose your scales and wavelet, and then plot the resulting coefficient matrix as a scalogram using matplotlib's imshow. The code for detecting discontinuities is a perfect example of the transform's power.
Interview Alert: You are tasked with building a model to predict stock market crashes from price data. A colleague suggests using standard time-series features like moving averages and momentum. How could you propose a more advanced feature set to capture multi-scale dynamics that might precede a crash?
A top-tier response would be: "In addition to standard features, I would use a wavelet transform to create a multi-scale representation of the price series. Market dynamics leading to a crash often involve interactions across different time horizons—for example, a breakdown of a long-term trend combined with a spike in short-term volatility.
I would implement this in two ways. First, I would generate scalograms from the return series over, say, the last year of data. These 2D images, which capture the full time-frequency landscape, would be fed into a CNN. This allows the model to learn complex, non-linear patterns that are indicative of an impending crash.
Second, to complement the CNN, I'd use a Discrete Wavelet Transform (DWT) to decompose the signal into several frequency bands. From each band, I would extract statistical features like variance, energy, and entropy. This creates a set of tabular features that explicitly quantify the behavior at different scales (e.g., 'volatility of the 2-4 day component', 'energy of the 16-32 day component'), which could then be fed into a Gradient Boosting model alongside the standard features."
Conclusion
Today, we've unlocked a new dimension in time series analysis. By moving beyond the time domain and into the joint time-frequency domain, we can create features that capture a far richer picture of a signal's dynamics.
Key Takeaways:
- Time-Frequency Localization: Unlike the Fourier Transform, which loses all time information, the wavelet transform tells you both what frequencies are in a signal and when they occur.
- Ideal for Non-Stationary Data: This property makes wavelets perfectly suited for analyzing financial time series, where volatility, trends, and cycles evolve over time.
- The Scalogram: The output of a CWT is a 2D matrix of coefficients that can be visualized as a scalogram, providing an intuitive map of the signal's energy across time and frequency.
- Multi-Scale Feature Creation: You can engineer features either by treating the scalogram as an image for a CNN or by computing statistical summaries on the different frequency sub-bands produced by the transform.
In our lessons so far, we have focused on extracting features from a single time series. In our next session, we will expand our view to engineer features that capture the relationships between multiple time series, such as correlations, spreads, and lead-lag effects—a critical skill for building robust financial models.