Recommended resources
The freely available resources this lesson will direct you to.
Welcome back. In the last lesson, you defined a service-level indicator (SLI) for a meaningful user journey: the proportion of eligible send-mail requests that are accepted durably within two seconds. An SLI tells you what happened; a service-level objective (SLO) sets the reliability target for that indicator over a stated period.
This lesson turns that target into a concrete operational number: an error budget. You will calculate how many failures—or, for a time-window SLO, how many bad measurement intervals—a service can have and still meet its SLO. This is central to SRE work because it makes the reliability-versus-change trade-off explicit.
From an SLO target to an error budget
Suppose the mail service has this SLO:
Over a rolling 30-day window, at least 99.9% of eligible send-message requests must receive durable acceptance within two seconds.
The SLO allows something less than perfection. That deliberate gap is the error budget:
When the target is expressed as a percentage, the equivalent calculation is:
For the mail-service target:
So the team has a budget of 0.1% bad eligible events during each 30-day compliance window.
An error budget is not a permitted outage quota to spend casually. It is a quantified allowance for the reality that systems change, dependencies fail, security patches must be applied, and no useful service can be operated at literal perfection. Its practical value is that it supports decisions: a service with substantial budget remaining can tolerate more release risk than one that has already consumed nearly all of its allowance.
Read the Google SRE Workbook’s explanation of why reliability targets should leave room for failure and how ratio-based SLIs make that allowance measurable.
In the opening discussion, read the case against a 100 percent target. Then continue in the “What to Measure: Using SLIs” section from the good-events ratio explanation. Focus on the distinction between an SLO target and the fraction of events it permits to be bad.
The core calculation
For a request-based SLO, the relevant events are the eligible requests in the compliance period. The total error budget is:
Use the goal as a decimal in the formula. For example, becomes , and its error allowance is .
For the mail service, assume that the rolling 30-day window contains 1,200,000 eligible send-message requests.
The service can therefore have at most 1,200 bad eligible requests in that particular 30-day window and still achieve a 99.9% result.
A useful way to check the result is to calculate the minimum required good events:
If at least 1,198,800 of those 1,200,000 requests are good, the SLO is met. The remaining 1,200 requests are the maximum permitted bad events.
A calculation workflow you can reuse
When a problem gives you an SLO and a time window, work through it in this order:
- Identify the SLO type. Is the event a request, a transaction, a job, or a measurement interval?
- Convert the goal to an allowed-bad fraction. For a 99.95% goal, the allowed-bad fraction is , or .
- Find the number of eligible events in the stated window. For request-based SLOs, this comes from actual or expected traffic.
- Multiply the allowed-bad fraction by eligible events.
- State the unit clearly. The answer might be bad requests, failed jobs, or bad minutes—not automatically “downtime.”
Concepts in service monitoring | Google Cloud Observability
Read Google Cloud Observability’s concise definition and formula for turning an SLO into an error budget.
First, in “Error budgets,” read how the budget supports maintenance and release decisions. Then read the calculation beginning the formula and example. Notice that the calculation depends on eligible events in the particular compliance period.
Budget used and budget remaining
The total budget tells you the maximum bad events allowed. During operations, you also need to know how much has already been consumed.
Let:
- be total eligible events.
- be good events.
- be observed bad events, where .
- be the total error budget.
Then:
Continue the mail-service example. Of 1,200,000 eligible requests, assume 350 were bad because they timed out, returned server errors, or exceeded the two-second threshold defined in the SLI.
The service has used approximately 29% of its budget and has 850 bad requests of remaining allowance.
Its current SLI over that full window is:
That is above the 99.9% SLO, so the service is currently compliant. The critical distinction is:
| Measure | Value | What it means |
|---|---|---|
| SLO target | 99.9% | Required proportion of good requests |
| Total error budget | 1,200 requests | Maximum bad requests allowed |
| Bad events observed | 350 requests | Failures counted so far |
| Budget consumed | 29.17% | Share of allowed failures already used |
| Remaining budget | 850 requests | Further bad requests possible before violation |
If bad events exceeded 1,200, the remaining budget would be negative and the SLO would be missed for that window.
Requests are not always minutes
People often translate availability targets into “minutes of downtime.” This can be useful, but only under the right SLO model.
A request-based SLO evaluates individual requests or transactions. It measures how much user work succeeded across the full window. If traffic is very high, a brief outage may consume a large number of error-budget events. If traffic is low, a longer quiet-period failure may consume fewer. This is usually appropriate when the user impact is proportional to the number of affected requests.
A windows-based SLO evaluates fixed measurement intervals, such as one-minute or ten-minute periods. A minute is good or bad based on a specified criterion. For example:
At least 99% of one-minute intervals in a rolling 30-day period must meet the defined availability condition.
Here, the “events” are minutes rather than requests:
At a 99% SLO:
The total budget is 432 bad one-minute intervals.
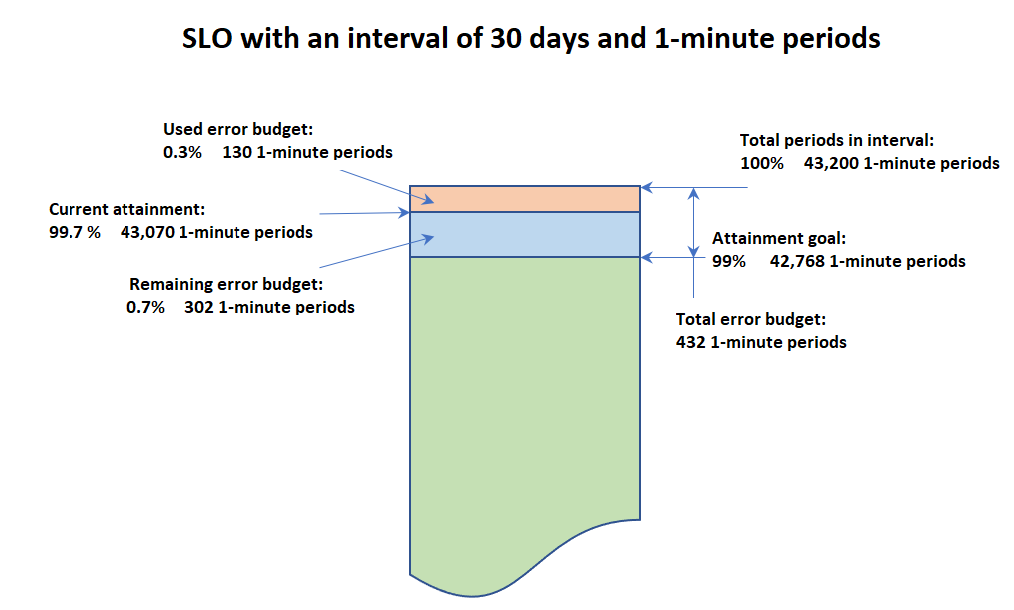
The image shows the same calculation in operational form:
- Total intervals: 43,200 minutes
- SLO goal: 99%, requiring 42,768 good minutes
- Total budget: 432 bad minutes
- Used budget: 130 bad minutes
- Remaining budget: 302 bad minutes
The current attainment is:
That is above 99%, even though part of the error budget has been spent.
Do not casually describe a request-based 99.9% SLO as “43.2 minutes of downtime per 30 days.” That conversion assumes the SLO is based on time intervals and that each interval has the same meaning. For the mail submission SLI from the previous lesson, the sound unit is bad eligible send requests, because that is what the SLI measures.
Concepts in service monitoring | Google Cloud Observability
Read the sections that distinguish calendar versus rolling periods and request-based versus windows-based SLOs. This distinction determines what an “event” is when you calculate a budget.
In “Compliance periods,” read calendar and rolling windows. Then, under “Compliance in request- and windows-based SLOs,” read from the two SLO types and the 30-day minute example. Focus on why a bad minute and a bad request are different budget units.
The time window changes how the budget behaves
Every SLO must state a compliance period, not just a percentage. A 99.9% SLO over one day and a 99.9% SLO over 30 days have the same allowed-bad percentage, but generally very different absolute budgets.
Two common window choices are:
| Window type | Definition | Operational consequence |
|---|---|---|
| Calendar window | A fixed period, such as a calendar month or quarter | The budget resets at the period boundary. It aligns well with reporting and business cycles. |
| Rolling window | The last fixed number of days, evaluated continuously | Older events leave the calculation as new events enter. It better reflects what users experienced recently. |
For a request-based rolling window, the number of eligible events can change throughout the day as traffic enters and old traffic leaves. That means the absolute budget can change too.
For example, with a 99.9% request-based SLO:
- At 100,000 eligible requests, the budget is 100 bad requests.
- At 1,000,000 eligible requests, the budget is 1,000 bad requests.
The percentage has not changed. The observed traffic volume has.
This is why an error-budget policy should not treat a small remaining count as the whole story. A remaining budget of 100 failures means different things for a low-volume internal tool and a high-volume customer API. Good SRE practice checks the SLI definition, traffic context, recent incident pattern, and the rate at which the budget is being consumed—not merely whether the remaining number is positive.
Error budgets guide reliability and delivery decisions
An error budget creates a shared language for product, platform, security, and operations work. Rather than debating whether a release “feels risky,” teams can ask whether the service is meeting its user-centered objective and how quickly its allowed failure margin is shrinking.
A simple policy might look like this:
| Budget condition | Typical response |
|---|---|
| Large budget remains and reliability is stable | Continue planned releases; use normal safeguards such as review, testing, and canary rollout. |
| Budget is being consumed unusually quickly | Investigate the cause; reduce release risk; prioritize remediation or rollback readiness. |
| Budget nearly depleted | Delay discretionary risky changes; focus engineering effort on stability and root causes. |
| Budget exhausted | Treat reliability work as urgent; restrict changes except those needed to restore service or address a critical security risk. |
Security is not automatically subordinate to the error budget. An actively exploited vulnerability may require an urgent patch even when reliability risk is high. In that situation, the operational goal is to minimize both kinds of risk: use peer review, staged deployment, rollback planning, and monitoring rather than ignoring either the security threat or the SLO.
The essential point is that a budget is an operational planning mechanism, not a scoreboard for blaming people after a failure.
Key takeaways
An error budget is the gap between perfect service and an SLO target. It states how many bad events the service can incur during its compliance period while still meeting the objective.
For a request-based SLO:
For the 99.9% mail-submission SLO with 1,200,000 eligible requests in 30 days, the budget is 1,200 bad requests. If 350 have occurred, 850 remain and about 29% of the budget has been consumed.
Finally, match the unit to the SLI:
- A request-based SLO produces a budget in bad requests, transactions, or jobs.
- A windows-based SLO produces a budget in bad intervals, such as minutes.
- The time window and its calendar or rolling behavior are part of the SLO itself.
Next, you will shift from reliability measurement to security analysis by constructing a threat model for a small cloud service: identifying its assets, trust boundaries, threats, and mitigations.