Recommended resources
The freely available resources this lesson will direct you to.
- Y1 27) Deflation - Causes and Consequences (Deflation can be Deadly!)www.youtube.com
- Myth #7: Deflation — Falling Prices — Is Unthinkable, and Would Cause a Catastrophic Depressionwww.youtube.com
- Deflation in a historical perspective, November 2005www.bis.org
- The costs of deflations: a historical perspectivewww.bis.org
Hello! Welcome to the second module of our course on deflation.
This lesson marks our shift from the "what" and "how" of measuring deflation to the "why" and "so what." We'll move beyond simply identifying falling prices to understanding their character and consequences.
Lesson Introduction
What this lesson covers: Today, we will tackle the crucial distinction between 'good' and 'bad' deflation. You will learn to analyze deflation not as a single phenomenon, but as two distinct outcomes driven by different economic forces: shifts in aggregate supply versus shifts in aggregate demand. We will evaluate historical periods, such as the late 19th century and the 1920s, to see real-world examples of productivity-driven "good" deflation.
Why it's important for your goals: Your goal is to develop a nuanced understanding of the pros and cons of deflation. This lesson provides the fundamental framework for that analysis. By the end, you'll be able to separate the benign, or even beneficial, types of deflation from the pernicious, recessionary kind. This is the bedrock upon which we will build our analysis of the Great Depression and Japan's lost decades.
Estimated time to complete: 60 minutes.
1. The Core Distinction: Good vs. Bad Deflation
At its heart, the debate about deflation's effects hinges on its cause. Is the general price level falling because of a collapse in spending, or because businesses have become vastly more efficient at producing goods and services?
To start, let's get a quick and clear overview of this distinction.
Activity: Watch a Video (3 minutes)
Please watch the first three minutes of the following video. It provides an excellent introduction to demand-side ('bad') versus supply-side ('good') deflation.
As the video explains, the key difference can be visualized perfectly using the Aggregate Demand-Aggregate Supply (AD-AS) model, a tool you'll be very familiar with from your economics background.
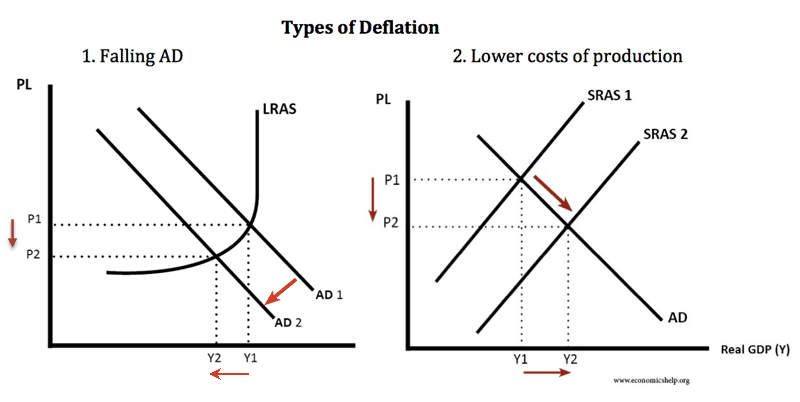
This image shows two AD-AS diagrams. The left diagram illustrates 'bad' deflation, where a fall in Aggregate Demand (AD) leads to a lower price level and lower Real GDP (a recession). The right diagram illustrates 'good' deflation, where an increase in Short-Run Aggregate Supply (SRAS) leads to a lower price level but higher Real GDP (economic growth).
Let's break this down:
-
Bad (Demand-Side) Deflation: This is what most people fear when they hear the word "deflation." It's caused by a significant drop in aggregate demand (a leftward shift of the AD curve). This could be due to a financial crisis, a collapse in consumer or business confidence, or contractionary monetary/fiscal policy. The result is a vicious combination: falling prices and falling output, leading to higher unemployment. This is deflation in the context of a recession.
-
Good (Supply-Side) Deflation: This is a much more benign, and often positive, phenomenon. It's caused by a significant increase in aggregate supply (a rightward shift of the AS curve). This is typically driven by:
- Productivity booms: Technological advancements (like the internet or AI) or process innovations that allow more output with the same inputs.
- Lower input costs: A fall in the price of key commodities like oil, or increased global competition pushing down the cost of intermediate goods.
The result is a virtuous combination: falling prices and rising output. Living standards increase as consumers' purchasing power grows.
A key nuance, as the video touches upon, is the role of expectations. Demand-side deflation is dangerous because it can become persistent and anticipated, leading consumers and businesses to delay spending, which further depresses AD and creates a deflationary spiral. Supply-side deflation is often viewed as temporary or unanticipated, meaning it doesn't become embedded in expectations in the same way.
2. A Deeper Look: The Theory of "Optimal" Deflation
While the AD-AS model gives us the basic story, economic theory has explored the concept of "good" deflation in greater depth. The most famous argument comes from Milton Friedman.
Activity: Read a Paper Extract (5 minutes)
Please read the following section from the Bank for International Settlements (BIS) working paper, "Deflation in a historical perspective." This section discusses the theoretical costs and benefits of deflation, including Friedman's famous "rule."
As you read, focus on:
- Friedman's argument for an optimal rate of deflation.
- How nominal rigidities (like sticky wages) complicate this argument.
Friedman's argument is elegant: in a frictionless world, the optimal quantity of money is achieved when the opportunity cost of holding it is zero. Since safe bonds yield a real interest rate, money should too. As money's nominal interest rate is fixed at zero, this implies that the price level should fall at a rate equal to the real interest rate. This is the theoretical pinnacle of "good" deflation.
However, as the paper notes, the real world is not frictionless. The Keynesian perspective, which dominates modern central banking, emphasizes the dangers posed by nominal rigidities:
- Sticky Wages: Unions, contracts, and simple human psychology make it very difficult to cut nominal wages. In a deflationary environment, if nominal wages can't fall while prices are falling, real wages rise. This increases the real cost of labor for firms, leading them to hire fewer workers and exacerbating unemployment.
- Sticky Prices: Not all prices adjust downwards smoothly, which can distort relative price signals.
This theoretical tension between the "optimal" deflation in a perfect world and the "dangerous" deflation in a world of rigidities is central to the entire policy debate.
3. Evaluating the Historical Evidence
Theory is one thing, but what does the historical record say? Have there been periods of "good" deflation?
The answer is a resounding yes. The narrative that deflation is always and everywhere a catastrophe is a relatively modern one, heavily influenced by the Great Depression.
Activity: Explore Historical Cases (15 minutes)
To explore this, we'll look at a few resources.
-
First, let's return to the Bordo and Filardo paper. Please read the sections detailing historical examples of good deflation from the 19th and 20th centuries.
-
Next, watch this short video from the Mises Institute. It presents a strong argument from the Austrian school of economics, which views productivity-driven deflation as the healthy norm of a capitalist economy. Pay close attention to the modern example of the computer industry.
-
Finally, let's look at a more recent, data-driven analysis from the BIS. This paper examines 140 years of data to test the link between deflation and growth. Please read the introduction and the section titled "Price deflations and output growth: link or no link?".
Synthesizing the Evidence:
These resources paint a clear and consistent picture that challenges the simplistic "deflation is always bad" narrative.
-
The "Great Deflation" (c. 1873-1896): As Bordo and Filardo describe, this period saw prices fall steadily in many industrial nations. Yet, it was also a time of massive economic growth, fueled by the "Second Industrial Revolution"—railroads, steel, and electricity. This is a textbook case of "good" deflation, where productivity gains were so immense that they outpaced the growth of the money supply (which was linked to gold), causing prices to fall while real incomes and output soared.
-
The "Roaring Twenties" (1921-1929): Similarly, after a sharp postwar recession, the 1920s in the US saw mild deflation alongside a spectacular economic boom driven by the proliferation of new technologies like the automobile, radio, and household appliances.
-
The Modern Empirical View: The 2015 BIS paper provides the statistical knockout punch. It finds that across 140 years of data, the strong negative association between deflation and low growth is almost entirely driven by one event: the Great Depression. Outside of that period, the link is weak. In the post-WWII era, years with mild deflation have actually seen slightly higher average growth than years with inflation. This strongly suggests that most modern, transitory deflations have been of the "good," supply-side variety.
The computer industry, as highlighted in the Mises video, is a perfect contemporary microcosm of this process. Tremendous productivity gains have led to drastically falling prices for computational power, fueling explosive growth and market expansion, not depression.
Check for Understanding
Given your work as an EdTech founder and your interest in technology, let's apply these concepts.
Question: Consider the rapid advancements in Artificial Intelligence. Many economists argue this represents a general-purpose technology that will unleash massive productivity gains across the economy.
- Based on today's lesson, what might be the potential consequences for the general price level and real output?
- Would you classify this potential outcome as 'good' or 'bad' deflation?
- What factors, drawing from our discussion of theory and history, might complicate this simple classification?
Take a moment to formulate your thoughts. This requires you to connect the AD-AS model, the historical precedents, and the theoretical nuances we've discussed.
Conclusion
This lesson provides a critical foundation for our study of deflation. You should now be equipped to analyze falling prices with a more discerning eye.
Key Takeaways:
- Deflation is not monolithic: Its effects depend entirely on its source. 'Good' deflation stems from positive supply shocks (e.g., productivity growth), while 'bad' deflation stems from negative demand shocks.
- Good deflation is pro-growth: It is characterized by falling prices and rising real output, leading to higher standards of living.
- History is full of good deflation: The late 19th century and the 1920s are classic examples of periods where rapid technological progress led to benign deflation and strong economic expansion.
- The Great Depression is an outlier: Modern empirical analysis shows that the strong negative association of deflation with economic calamity is largely an artifact of the 1930s.
Preview of the Next Lesson:
Now that we've established that not all deflation is bad, our next lesson will do a deep dive into why 'bad' deflation is so feared. We will critically evaluate the primary arguments against deflation, including the risks of deferred consumption, the problems of wage rigidity, and Irving Fisher's powerful 'debt-deflation' spiral. This will set the stage for understanding the catastrophic nature of the Great Depression.