Recommended resources
The freely available resources this lesson will direct you to.
Hello! Welcome back to the course.
In our last lesson, we tackled the crucial and subjective task of estimating a property-specific discount rate. We learned that this rate is our personal required rate of return, and we constructed it using the Build-Up Method or estimated it using the cap rate. That discount rate is the tool we use to determine the present value of future cash flows.
Now, we need to generate those future cash flows. This lesson moves from the "why" of discounting to the "what." Our goal is to project multi-year rental income and operating expenses with growth assumptions. This process is the foundation of building a real estate pro forma, which is essentially a forward-looking financial forecast for an investment property. We'll be extending the single-period calculations of Gross Income and NOI you mastered in Module 1 into a dynamic, multi-year model.
1. The Real Estate Pro Forma: A Forward-Looking Statement
Before we start projecting, let's clarify what a pro forma is. It's a simplified, combined income and cash flow statement that projects a property's financial performance over a holding period (typically 5-10 years). It allows us to analyze how an investment is likely to perform under a set of assumptions.
To get a clear overview of the typical structure, please watch the first few minutes of the following video. It expertly lays out the standard components from potential revenue down to cash flow.
The Real Estate Pro-Forma: Calculations, Examples, and Scenarios
This video from Mergers & Inquisitions provides an excellent introduction to the structure of a real estate pro forma. It visualizes the flow from top-line revenue down through all the expenses.
Watch the section from 02:13 to 03:33. Focus on the overall structure: Potential Revenue -> Deductions -> Operating Expenses -> Capital Costs -> Debt Service -> Cash Flow.
As you saw, the pro forma starts with potential revenue and systematically subtracts costs to arrive at different measures of income and cash flow. Our focus today is on the top part of this statement: projecting revenue and operating expenses to arrive at a multi-year Net Operating Income (NOI) forecast.
2. Projecting Multi-Year Rental Income
Projecting income isn't just about taking this year's rent and multiplying it out. It requires a detailed, line-by-line approach that starts with the current situation and layers on logical growth assumptions.
2.1. Gross Potential Rent (GPR) and Growth
The starting point for any revenue projection is the Gross Potential Rent (GPR). This is the total rent you would collect if the property were 100% occupied at current market rates. The primary source for this is the property's rent roll—a document listing every unit, its tenant, lease term, and rent amount.

To project GPR into the future, you need to apply a rent growth rate. This is a critical assumption based on:
- Market Growth: Your analysis of the local market (from Module 4) will inform your general rent growth assumption. Is the local economy growing? Is demand for housing strong?
- Lease Clauses: Some leases in Spain might include an annual rent increase tied to the Índice de Precios de Consumo (IPC), the Consumer Price Index.
- Value-Add Strategy: If you plan renovations, you might project a larger rent bump in the year after the upgrades are complete to bring rents up to the new market level.
2.2. Vacancy, Concessions, and Bad Debt
A property is rarely 100% occupied or collects 100% of its rent. We must account for this by subtracting a vacancy allowance.
- Physical Vacancy: The income lost when a unit is empty between tenants.
- Concessions: "Free" months of rent offered to attract a new tenant.
- Bad Debt / Credit Loss: Income lost when a tenant fails to pay rent.
Collectively, these are often modeled as a single "Vacancy and Credit Loss" line item, typically estimated as a percentage of GPR (e.g., 3-5% for a stable residential property).
2.3. Other Income
Don't forget ancillary income streams, which are common in multifamily properties. This could include fees for:
- Parking spaces
- Storage units
- Laundry facilities
Each of these income streams should be projected with its own reasonable growth assumption.
2.4. Effective Gross Income (EGI)
After making these adjustments, you arrive at the Effective Gross Income (EGI).
\text{EGI} = \text{GPR} - \text{Vacancy & Credit Loss} + \text{Other Income}
This is your realistic projection of the total revenue the property will generate.
Real Estate Pro-Forma: Calculations, Examples, and ...
For a clear breakdown with simple calculation examples for each revenue and deduction component, this article is a useful reference.
Read the section titled 'Revenue and Effective Gross Income'. Pay attention to the simple calculation examples for Base Rental Income, Vacancy, Concessions, and Expense Reimbursements.
3. Projecting Multi-Year Operating Expenses (OpEx)
Once you have your EGI projection, the next step is to project your operating expenses. We itemized these in Module 1, but now we'll forecast them over time.
3.1. Spanish Operating Expenses
For our analysis in Spain, the key recurring operating expenses are:
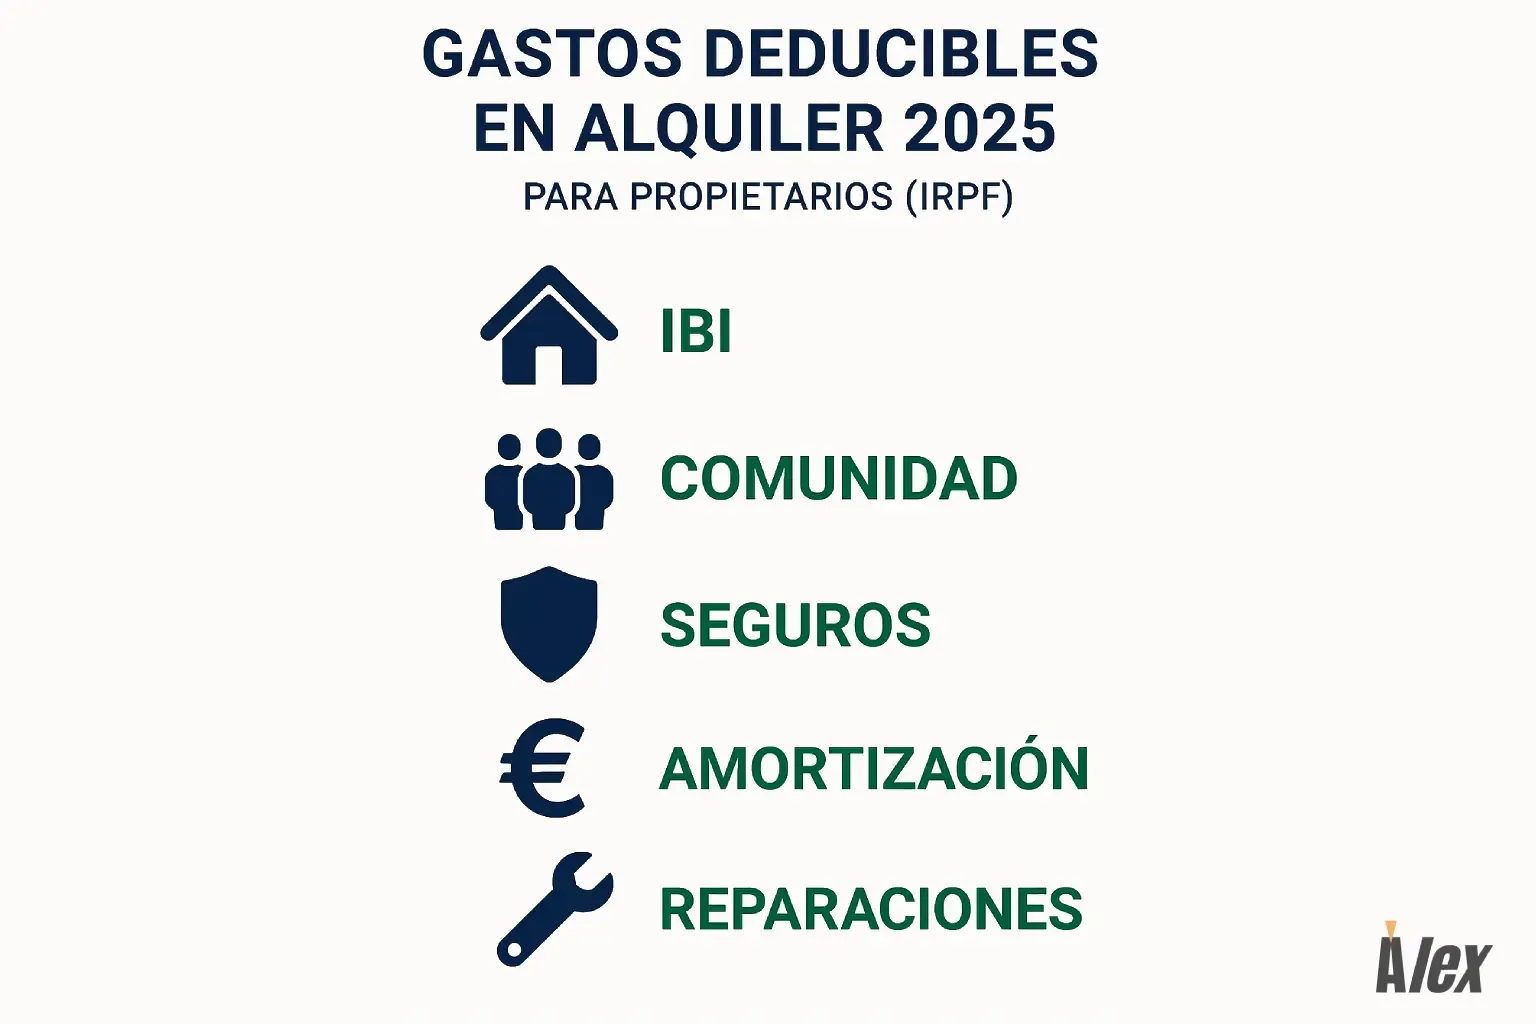
- IBI (Impuesto sobre Bienes Inmuebles): The annual municipal property tax. This is a major expense. A key risk to underwrite is that the municipality may reassess the property's valor catastral (cadastral value) after your purchase, leading to a significant tax increase.
- Comunidad (Gastos de Comunidad): Community fees for the building, covering maintenance of common areas, elevators, etc.
- Seguros: Property and liability insurance.
- Reparaciones y Conservación: Day-to-day repairs and maintenance.
- Utilities (Suministros): Water, electricity, and gas for common areas, or for the units if not paid directly by tenants.
- Property Management Fees: Typically a percentage of EGI (e.g., 4-8%).
3.2. Projecting Expense Growth
You need to apply a growth factor to each expense line item. A common approach is to use a combination of methods:
- General Inflation Rate: For many expenses like maintenance, insurance, and utilities, applying a general inflation forecast (e.g., 2-3% per year) is a reasonable starting point.
- Percentage of EGI: Property management fees are almost always projected as a percentage of EGI. As your revenue grows, this expense grows proportionally.
- Per Unit Amount: Some expenses, particularly Reserves for CapEx, are often budgeted as a fixed amount per unit per year (e.g., €250 per unit/year). This amount is usually held constant or grown slightly with inflation.
- Specific Projections: Property taxes (IBI) should be handled with care. You might assume it grows with a general inflation rate, but you should also stress-test a scenario where the tax jumps after a post-purchase reassessment.
The following article provides a practical, spreadsheet-focused look at how to set up these assumptions for Year 1 and subsequent years.
Multifamily (Apartment) Proforma Excel Template
This article from Tacticares demonstrates how to build out pro forma assumptions in a spreadsheet. It shows practical methods for projecting both income and expenses.
Read the sections 'Real Estate Proforma Year 1 Assumptions' and 'Real Estate Proforma Years 3+ Assumptions'. Notice the different methods available for projecting each line item (% increase, % of GPR/EGI, per unit) and how the assumptions are simplified for later years.
4. Assembling the Multi-Year NOI Projection
With your revenue and expense projections, you can now lay them out in a table to calculate NOI for each year of your holding period.
Example 5-Year NOI Projection (Simplified)
| Line Item | Year 1 | Year 2 | Year 3 | Year 4 | Year 5 |
|---|---|---|---|---|---|
| Gross Potential Rent (GPR) | €100,000 | €103,000 | €106,090 | €109,273 | €112,551 |
| - Vacancy (5%) | (€5,000) | (€5,150) | (€5,305) | (€5,464) | (€5,628) |
| Effective Gross Income (EGI) | €95,000 | €97,850 | €100,785 | €103,809 | €106,923 |
| Operating Expenses | |||||
| - IBI & Other Taxes | €2,000 | €2,040 | €2,081 | €2,122 | €2,165 |
| - Comunidad & Utilities | €6,000 | €6,120 | €6,242 | €6,367 | €6,495 |
| - Insurance & Maintenance | €4,000 | €4,080 | €4,162 | €4,245 | €4,330 |
| - Management Fee (5% of EGI) | €4,750 | €4,893 | €5,039 | €5,190 | €5,346 |
| Total Operating Expenses | €16,750 | €17,133 | €17,524 | €17,924 | €18,336 |
| Net Operating Income (NOI) | €78,250 | €80,717 | €83,261 | €85,885 | €88,587 |
Assumptions: 3% rent growth, 2% OpEx inflation (except management fee).
As a software engineer, you can conceptualize this as a loop. You start with your Year 1 inputs and then iterate for the length of the holding period. In each iteration, you apply your growth functions to the previous year's figures to calculate the next year's values. We will implement exactly this logic in Python in a future lesson.
Test your understanding!
You are analyzing a small apartment building in Spain.
- Year 1 GPR is €50,000.
- Year 1 Operating Expenses are €15,000 (this includes a 4% management fee).
- You assume rent will grow by 4% per year.
- You assume OpEx (excluding management fee) will grow by 2% per year.
- Vacancy is 5% of GPR. Management is 4% of EGI.
What is the projected NOI for Year 2?
Show answer
Year 1 Calculation (for reference):
- GPR: €50,000
- Vacancy (@5%): -€2,500
- EGI: €47,500
- Management Fee (@4% of EGI): -€1,900
- Other OpEx: -€13,100 (€15,000 total - €1,900 mgmt)
- NOI (Year 1): €47,500 - €15,000 = €32,500
Year 2 Projection:
- Project GPR: €50,000 * 1.04 = €52,000
- Calculate EGI:
- GPR: €52,000
- Vacancy (@5%): -€2,600
- EGI: €49,400
- Project OpEx:
- Other OpEx (grows by 2%): €13,100 * 1.02 = €13,362
- Management Fee (@4% of new EGI): €49,400 * 0.04 = €1,976
- Total OpEx: €13,362 + €1,976 = €15,338
- Calculate NOI for Year 2:
- EGI - Total OpEx = €49,400 - €15,338 = €34,062
5. An Introduction to Scenario Analysis
Your projections are only as good as your assumptions. Because the future is uncertain, it's wise to model different potential outcomes. This is called scenario analysis. Instead of creating one forecast, you create three:
- Base Case: Your most likely scenario, using your best-guess assumptions.
- Downside Case: A pessimistic scenario (e.g., a recession causes rents to fall and vacancy to rise).
- Upside Case: An optimistic scenario (e.g., strong economic growth leads to higher-than-expected rent growth).
This topic is covered in depth in Module 8, but it's important to introduce the concept now. Watch how the assumptions for rent, vacancy, and expenses are interconnected and changed to model a recession.
The Real Estate Pro-Forma: Calculations, Examples, and Scenarios
This final clip from the M&I video demonstrates the power of scenario analysis. It shows how you can adjust your growth assumptions to model different economic futures.
Watch from 12:40 to 17:00. Note how in the 'Downside' and 'Extreme Downside' cases, a drop in rent is correlated with a rise in vacancy and a change in expense growth. This interconnectedness is key to building realistic scenarios.
Conclusion
In this lesson, we transitioned from static, single-period analysis to dynamic, multi-year forecasting. You learned how to build a projection for a property's income and expenses by layering growth assumptions onto a baseline derived from current data.
Key Takeaways:
- A pro forma is a multi-year financial forecast for a real estate investment.
- Revenue projections start with the Gross Potential Rent (GPR) from the rent roll, which is then adjusted for vacancy/credit loss and grown over time.
- Operating expense projections must be tailored to the local context (e.g., IBI, Comunidad in Spain) and grown using appropriate assumptions (e.g., inflation, % of EGI).
- The result is a multi-year Net Operating Income (NOI) projection, which forms the basis of your cash flow analysis.
- Building multiple scenarios (Base, Downside, Upside) is critical for understanding the range of potential investment outcomes.
Preview of the Next Lesson:
We have successfully projected NOI over our holding period. However, NOI is not the cash flow that ends up in your pocket. In the next lesson, we will model a complete multi-year pro forma cash flow statement. This involves incorporating two major non-operating cash flows we've previously discussed: capital expenditures (CapEx) and debt service (your mortgage payments). This will take us from NOI to Pre-Tax Cash Flow.