Recommended resources
The freely available resources this lesson will direct you to.
Introduction
Welcome to our final lesson in the module on Money, Banking, and Monetary Policy. In our previous lessons, we've seen the power of central banks. In the short run, they can use monetary policy to influence aggregate demand, stabilizing the economy. In the long run, as we saw with the quantity theory of money, they are the ultimate arbiters of the inflation rate.
However, this power is not absolute. There are circumstances where the standard tools of monetary policy can lose their effectiveness, leaving a central bank unable to stimulate a struggling economy. Your learning outcome for this lesson is to describe the limits of monetary policy, including the liquidity trap and the zero lower bound.
We will explore two critical constraints that have become highly relevant in the wake of the 2008 financial crisis and other recent economic downturns. Understanding these limits is crucial for a complete picture of modern macroeconomics.
1. The Zero Lower Bound (ZLB)
The most fundamental constraint on conventional monetary policy is simple: a central bank cannot push nominal interest rates much below zero. This is the zero lower bound (ZLB).
Why is this the case? Imagine your bank announced a -1% interest rate on savings accounts. This means you would have to pay the bank to hold your money. Your alternative is simple: withdraw your funds and hold them as physical cash, which has a 0% nominal interest rate. Because people can always choose to hold cash, it's very difficult for central banks to enforce significantly negative interest rates.
To get a clear definition and see some real-world examples, please start with this short reading.
This article from Economics Help provides a straightforward definition of the zero lower bound and gives recent historical examples of when major economies, like the US and UK, have encountered this limit.
Read the first part of the article, down to the section titled 'Increasing the Money supply at the ZLB rate'. Focus on the definition and the historical examples provided.
The true problem of the ZLB becomes clear when we remember the Fisher equation from Module 8:
It is the real interest rate that drives investment and consumption decisions. At the ZLB, the nominal rate is stuck at or near zero. The equation becomes:
This means the only way a central bank can achieve a negative real interest rate to stimulate the economy is by creating expectations of positive inflation. If inflation expectations are zero or, even worse, negative (deflation), the real interest rate will be positive, which can stifle economic activity.
For a more formal explanation of this constraint, please review the following text from a central bank publication.
Monetary-Policy Strategies at the Zero Lower Bound
For a more formal and detailed look, this document from Denmark's central bank explains the mechanics of the zero lower bound and why it acts as a significant constraint on monetary policy.
Read the section titled 'MONETARY POLICY AT THE ZERO LOWER BOUND ON INTEREST RATES', including Box 1. This will reinforce the concepts of how policy rates influence market rates and why the zero bound is an 'inherent limitation'.
2. The Liquidity Trap
When an economy is stuck at the zero lower bound, it can fall into what John Maynard Keynes famously called a liquidity trap. In this situation, conventional monetary policy becomes completely ineffective.
A liquidity trap occurs when interest rates are so low that the return on holding interest-bearing assets (like government bonds) is virtually the same as the return on holding cash (which is zero). Because cash is the most liquid asset (it can be spent immediately), people and banks become indifferent between holding bonds and holding cash.
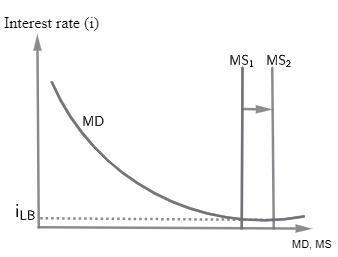
If the central bank tries to stimulate the economy by increasing the money supply (e.g., through open market operations where it buys bonds), people and banks are happy to sell their bonds for cash and then simply hold that cash. The extra money gets "trapped" in savings or bank reserves rather than being spent or lent out. As a result, the increase in the money supply fails to lower interest rates further and has no effect on aggregate demand.
The following video provides an excellent explanation of this concept, using the post-2008 financial crisis as a motivating example.
Liquidity Traps- Macroeconomics
This engaging video from Jacob Clifford explains what a liquidity trap is and why it poses such a significant problem for central bankers. It starts by looking at real-world economic data that points to this very problem.
Watch the first 3 minutes and 23 seconds of the video. Pay close attention to how the money market graph is modified to show a horizontal section in the money demand curve, which represents the trap.
We can visualize the liquidity trap clearly on the money market graph. As interest rates approach zero, the demand for money becomes perfectly elastic (horizontal).
3. The Danger of a Deflationary Spiral
The combination of the zero lower bound and a liquidity trap is especially dangerous if the economy starts to experience deflation (a falling price level). This can trigger a vicious, self-reinforcing downturn known as a deflationary spiral.
Here’s the logic, which builds on your analytical background:
- The economy is in a recession, and prices start to fall (deflation, so is negative).
- The economy is at the ZLB, so the nominal interest rate is 0%.
- The real interest rate is . Since is negative, the real interest rate becomes positive and rises as deflation gets worse. For example, if deflation is 2% (), the real interest rate is .
- This rising real interest rate discourages borrowing and investment, further depressing aggregate demand.
- The drop in aggregate demand worsens the recession and leads to even more deflation.
- The cycle repeats.
In this scenario, the central bank's inability to lower nominal rates means that monetary policy is not just ineffective; the situation can actively worsen on its own.
The following video provides a more advanced graphical look at this mechanism.
The Zero Lower Bound with IS-MP and AD
This video provides a more technical look at how a deflationary spiral works. It uses a slightly different macroeconomic model (the IS-MP model) than the AD-AS model we've focused on. Do not worry about the new graphical details; instead, focus on the core logic explained: how falling inflation at the zero bound can perversely increase real interest rates and worsen a recession.
Watch from 00:30 to 02:11 and then from 05:21 to 06:51. The first segment explains how the real interest rate behaves at the ZLB. The second segment illustrates the dangerous feedback loop where falling inflation causes output to fall, creating a 'deflationary spiral'.
4. Beyond the Limits: Unconventional Policies
So, if conventional monetary policy hits its limits, are central banks completely powerless? Not quite. In recent decades, especially since 2008, central banks have developed unconventional monetary policies to use when stuck at the ZLB. These include:
- Quantitative Easing (QE): Large-scale purchases of long-term government bonds and other assets. The goal is to lower long-term interest rates directly and inject liquidity into the financial system, even when short-term rates are at zero.
- Forward Guidance: Communicating the central bank's intentions about the future path of policy rates. By promising to keep rates "lower for longer," a central bank can influence current long-term interest rates and boost confidence.
- Negative Interest Rates: While there are practical difficulties, some central banks (e.g., in Europe and Japan) have experimented with slightly negative policy rates.
These are advanced topics, but it's useful to know they exist as a response to the limits we've discussed.
Conclusion
In this lesson, we have explored the critical limitations of conventional monetary policy. While powerful under normal circumstances, its effectiveness diminishes and can disappear entirely when faced with the zero lower bound and a liquidity trap.
Key Takeaways:
- The Zero Lower Bound (ZLB) prevents central banks from cutting nominal interest rates below zero, limiting their ability to lower real interest rates during periods of low or negative inflation.
- A Liquidity Trap is a situation, typically at the ZLB, where increases in the money supply fail to lower interest rates or stimulate spending because people and banks choose to hoard the extra cash.
- The combination of these factors can lead to a dangerous deflationary spiral, where falling prices cause real interest rates to rise, further depressing the economy.
- When faced with these limits, central banks may turn to unconventional policies like quantitative easing and forward guidance.
Preview of the Next Module:
This lesson concludes our deep dive into the macroeconomic tools of fiscal and monetary policy. We now have a solid understanding of how a domestic economy functions and how it is managed. In our next and final module, we will broaden our perspective to the global stage, exploring International Trade and Open-Economy Macroeconomics. We will begin by examining the fundamental question of why countries trade with each other, using the powerful principle of comparative advantage.