Recommended resources
The freely available resources this lesson will direct you to.
Hello! In the last two lessons, you established what one row represents and what each column does. Now you’ll bring an export into Excel without losing that structure. By the end of this lesson, you’ll have imported a CSV, checked that its records landed in the right columns, and confirmed that the result is a structured Excel table.
Plan for about 40 minutes. Most of that time is hands-on; you can use the small storefront export below rather than finding a file of your own.
Start with a CSV you can inspect
A CSV is a plain-text file. In this example, the first line contains column names, each subsequent line is a product-line record, and commas separate the fields. It is not yet an Excel workbook or an Excel table.
On Windows, open Notepad, paste the following text, and save it as storefront_lines.csv. In the Save dialog, choose All files for Save as type so Notepad does not add a .txt extension. Keep a copy of this file unchanged.
LineID,OrderID,CustomerID,OrderDate,Country,ProductCategory,Units,UnitPrice,LineRevenue
L1,O101,C7,2025-06-01,US,Shirts,2,20,40
L2,O101,C7,2025-06-01,US,Hats,1,10,10
L3,O102,C8,2025-06-02,UK,Shirts,1,20,20
L4,O103,C7,2025-06-03,US,Hats,3,10,30
This is the same four-line scenario you analyzed previously. Its expected shape is nine columns and four data rows, plus one header row. O101 appears twice because one order contains two product lines. That repetition is correct at this dataset’s grain.
For a real Shopify or other storefront export, the principle is the same: keep the original export and inspect it before calculating anything. Use a redacted export for practice if it contains customer information.
Import, then check the preview
Watch How to Convert CSV to Excel (Simple and Quick) from Excel Tutorials by EasyClick Academy. The useful part is not merely finding the Import button: notice how changing the delimiter changes the column layout in the preview.
How to Convert CSV to Excel (Simple and Quick)
EasyClick Academy demonstrates Excel’s From Text/CSV route and shows why the delimiter must match the file.
Watch finding the import, then checking the delimiter. Finally, watch loading the data. Focus on what the preview lets you verify before records enter the sheet.
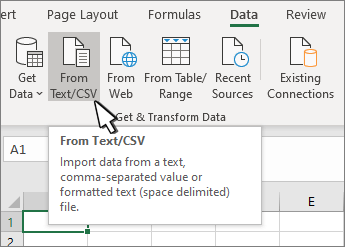
In a blank Excel workbook, select Data > From Text/CSV, choose storefront_lines.csv, and inspect the preview before clicking Load. Excel’s ribbon may look slightly different across versions, but the command is generally in Get & Transform Data.
Check the preview against the file you saved:
- Do the headers occupy nine separate columns, from
LineIDthroughLineRevenue? If the entire line appears in one column, set the delimiter to Comma. - Are
O101and the other order IDs still recognizable? IDs are labels, not quantities. With a real export containing an ID such as00101, check especially carefully: automatic number detection can remove leading zeros. Preserve such a column as text during import rather than trying to restore its original value afterward. - Are there four data records, with L1 through L4 represented? A plausible-looking preview can still have a missing column or an incorrectly split field.
For this practice file, once the preview is correct, click Load. Avoid Transform Data for now; later lessons will cover cleaning and reproducible transformations. You may find that Excel has already loaded the result as a formatted table. We’ll verify that rather than assuming it.
Make the range a structured table
An Excel table is more than cells with colored shading. It has a defined boundary, headers that Excel recognizes as field names, a table name, and controls for sorting and filtering. Unlike a fixed cell range, it can also expand when you add records.
Read the short portions of Dave Bruns’s Excel Tables at Exceljet before checking your import.
Exceljet explains how to create a table and what distinguishes it from an ordinary range. Read this for the practical setup, not for every table feature.
In “1. Creating a table is fast,” read the creation steps. Then, in “6. Tables expand automatically” through “8. Rename a table anytime,” read the table features. Notice why unique headers and a meaningful table name matter.
Now click a cell inside your imported data and look for a Table Design tab on the ribbon; some Excel versions label it Table Tools > Design.
If Table Design appears: the import has already produced a structured table. Do not press Ctrl+T again. Find the Table Name box on that tab and rename the table StorefrontLines.
If Table Design does not appear: check that your header row is present and there are no blank rows inside the data. Click a cell in the range and press Ctrl+T (or use Insert > Table). Confirm that the selected range includes all nine columns and four records, tick My table has headers, and click OK. Then use Table Design to name it StorefrontLines.
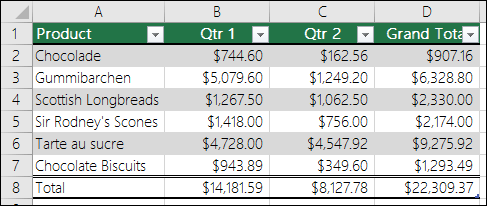
For a few minutes of extra hands-on practice, try the route you did not use above: open the original CSV with File > Open in a separate workbook. That route may give you an ordinary cell range. If so, convert it with Ctrl+T, checking the header box and selected boundary. The two routes should lead to the same essential result—a named table containing the source records—even though From Text/CSV may create the table automatically.
Verify the result and save the right file
Before treating the import as analysis-ready, audit it against the source. In StorefrontLines, you should see four product-line rows, nine named columns, and OrderID O101 on both L1 and L2. That repeated ID is not a duplicate record. LineRevenue should contain 40, 10, 20, and 30; those amounts total 100. If a value has shifted under the wrong header, return to the import preview and check the delimiter rather than working around the error in formulas.
Also check the table boundary. Click the last data cell and confirm that L4 belongs to the table, while the worksheet cells below are not mistaken for additional source records. A filter arrow on a header is useful evidence, but Table Design and the name StorefrontLines are the clearer confirmation that this is an Excel table rather than merely a colored range.
Finally, save your work as an Excel workbook (.xlsx), for example storefront_analysis.xlsx. Keep storefront_lines.csv as the original source. Saving the workbook gives your table, its name, and later Excel work a home without confusing that work with the raw export.
Key takeaways
Importing is a small but consequential analysis step: preview the column split, check record identity and count, confirm the table boundary, and save an .xlsx workbook while retaining the source CSV. You now have a named table whose rows still represent product lines and whose columns are ready for analysis.
Next, you’ll use Excel formulas with relative, absolute, and mixed cell references. A verified table gives those calculations a trustworthy starting point.